By: Ian Geertsen
Analyzing the Metric
While we’ve been able to take a look at how the defensive deterrence metric analyzes players, it is equally important to analyze the metric itself to check for accuracy and validity. There are many ways we could go about doing this, ranging from more empirical to more subjective; hopefully you looked at the metric’s rankings among my sample with a critical eye yourself. One of the simplest and most effective ways of testing the validity of a metric, though, is by comparing it to other known and reliable metrics.
Defensive Impact Metrics
While my metric does not attempt to measure a player’s overall defensive value, if it has been designed well we would at least expect there to be some correlation between a player’s defensive deterrence score and their overall defensive value. In case you were wondering if this is actually the case, we’re going to test that right now. For this analysis I decided to compare my defensive deterrence valuations with the scores of four different defensive impact metrics: defensive LEBRON, defensive box plus/minus (DBPM), defensive real plus-minus (DRPM), and defensive RAPTOR. First I collected the scores from these four metrics for each of the players in my sample. After normalizing each of the metrics so that they’re all comparable, I added up the four metrics for each player to give them a traditional defensive metric valuation. Here’s how my original 65 player sample ranks according to these impact metrics:
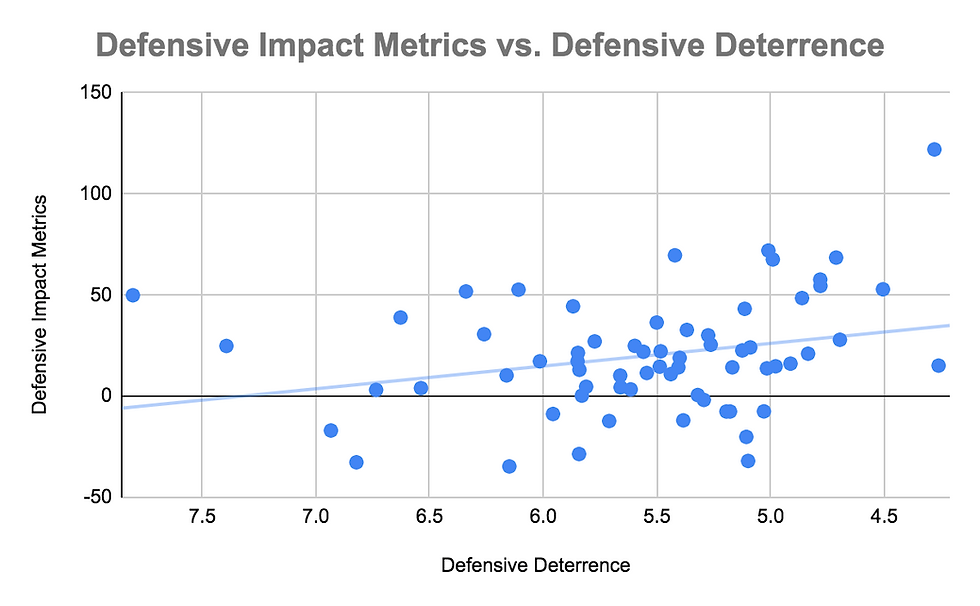
For context, the average value for among this sample is 20—for additional context, impact metrics seem to think Rudy Gobert is pretty good at defense. While these metrics aren’t perfect, as no single number metric ever will be, they seem to do a good enough job of quantifying defensive performance. The placements of Rudy Gobert, Nerlins Noel, Draymond Green, Myles Turner, and Marc Gasol in the top five is inoffensive at worst, and the rankings of Robin Lopez, James Wiseman, Alexsej Pokusevski, Enes Kanter, and M. Bagley III in the last five spots seems acceptable as well. But we’re not here to test the accuracy of these metrics; after all, people get paid to come up with this stuff. When we compare the results of this list with the results created by my defensive deterrence metric, we can see a correlation coefficient of 0.271, a value that could only be considered a very low correlation if even that.

It should be noted that my defensive deterrence metric includes the adjustment for team responsibility. While this is useful for the purposes of the metric, it is not necessary for quantifying overall defensive impact, and it likely causes my metric to stay further away from the results of the combined impact metrics. When we remove the team responsibility adjustment from the equation, we can see that the correlation coefficient increases to 0.318; an improvement, but still nothing to write home about. This analysis shows that we see little-to-no correlation between defensive impact metrics and defensive deterrence, but what would happen if we compared my metric to a pre-existing one that was also designed to measure the same thing?

Rim Deterrence
The website Basketball Index hosts a wide array of metrics that they both collect from other sources and measure themselves; one such example is a metric they call “Rim Deterrence,” a formula designed to measure how effectively a defender is able to keep offensive players away from the rim. Before getting into this, I’d like to pettily point out that I came up with the idea and name of my metric before discovering the existence of this one. While I was a little sad that I wasn’t the first one to attempt to solve this problem, the existence of this metric actually comes in handy because I can use it to test the reliability of my own formula. According to b-ball index’s rim deterrence, here are how the players in my sample are ranked and evaluated:
Basketball index also includes percentiles and letter grades for their rankings—what a bunch of try-hards. As you can see, their list doesn’t come out exactly as one might expect it to either. When looking at the relationship between my defensive deterrence and their rim deterrence, we see a correlation coefficient of 0.107, which is certainly less than ideal. When we remove our team responsibility adjustment, however, that value shoots up to 0.391. While this coefficient still represents a relatively small correlation, the fact that taking away this adjustment caused this correlation to increase this much is a bit concerning. I was even expecting the removal of the responsibility portion to increase the correlation, but the fact that it hikes it up so much gives me doubts about the responsibility adjustment, and not for the first time.

It should be noted that, because basketball index’s rim deterrence and my defensive deterrence both give lower values to greater defensive impact, the negative trendline actually represents a positive correlation in this case—the x-axis values of the graphs have also been reversed for more intuitive viewing. We can repeat the correlation analysis that we just did, except this time using the rim deterrence percentiles provided by b-ball index; this gives us a correlation coefficient of 0.140, still showing a lack of any real correlation. When we calculate the correlation after removing the team responsibility adjustment, we now see a correlation coefficient of 0.455. This is our strongest correlation yet, and once again we see a massive spike in correlation after removing our metric’s section on team responsibility.

All in all, I’ll admit that these analyses haven’t shown as strong of an association between my metric and other metrics as I would have hoped. While I wish this were not the case, let’s see if we can determine why this is occurring by looking closer at the individual parts of the defensive deterrence metric.

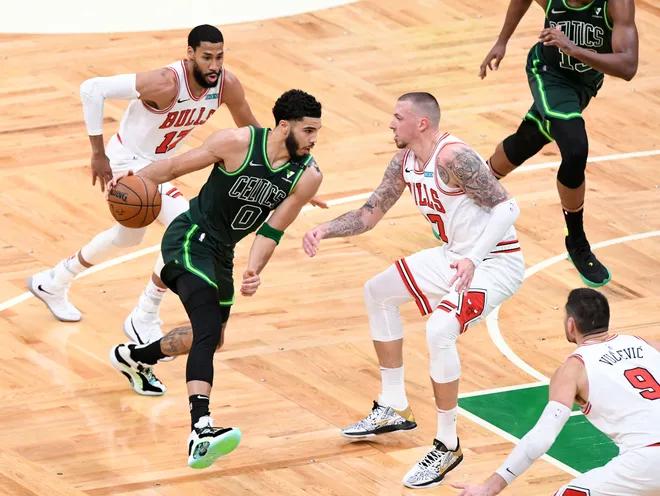
Chicago’s Daniel Theis (center), shown guarding Boston’s Jaylen Tatum (2nd from left), was ranked first out of my sample of NBA players in basketball index’s rim deterrence metric. His teammate Nikola Vučević (far right) was ranked second among the sample.
Breaking Down The Metric
Looking individually at each of my metric’s five main categories, we can get an idea for which of them value players similarly to pre-existing metrics and which of them do not. Starting with our opponent shots from less than five feet category: the correlation between this category’s isolated results and the four normalized defensive impact metrics I brought up earlier is 0.136, while the category’s correlation coefficient with b-ball index’s rim deterrence is 0.264. If we do the same calculations for the other five categories, here’s what we end up with:
This chart tells us that the shots from the restricted area and opponent free throws attempted categories share the most correlation with the defensive impact metrics and b-ball index’s rim deterrence, suggesting that they are the most accurate in terms of projecting actual value. The single highest correlation comes from the shots in the restricted area category and rim deterrence metric. This coefficient of 0.652 suggests a strong correlation between these two valuations. While I can’t say how that correlation would project to a larger sample, I can say that the restricted area category seems to be one of the most valid categories in my metric, if not the most valid. While I expected this outcome for the restricted area category, this result from the free throws category definitely surprised me. I don’t know if it speaks to the validity of this category or the inaccuracy of the others, but either way I was pleasantly surprised to be proven wrong about a category that I projected to be one of the least accurate and reliable out of the bunch.
The weakest correlations by far come from the shots in the paint category; finishing last out of the five categories in correlation to both the defensive metrics and rim deterrence, this category even showed a slight negative correlation with b-ball index’s rim deterrence. It doesn’t take much of a statistical background to know that that’s not good. This is far from the first time that the opponent shots in the paint (non-RA) category has shown an inability to correctly predict a player’s rim deterring ability, and in retrospect it clearly looks like the least reliable of these five categories based on multiple points of evidence.
The other aspect of my metric that has shown multiple warning signs throughout this project is the team responsibility portion. It seems to have an unnecessarily large impact on the metric as a whole, but is this really the case? My calculations suggest that it might be: the correlation coefficient of defensive deterrence and team responsibility was 0.888, a very strong correlation. This suggests that team responsibility either has a very large impact on the calculation of the metric or that team responsibility is highly associated with defensive deterring ability. But which one is it, or at least which one has a stronger effect? To try and figure this out, we can look at the correlation between team responsibility and defensive deterrence without the responsibility adjustment; if the correlation is still high, this would suggest that responsibility and deterrence are actually correlated, whereas a low correlation would imply that the large correlation we saw before was just a result of team responsibility’s overly large impact on the metric. Doing the calculation gives a correlation coefficient of -0.027, suggesting the latter. Another way to test the impact that team responsibility has on the metric is by taking the correlation between defensive deterrence and defensive deterrence without the responsibility adjustment; a high correlation would imply that team responsibility has a relatively small effect, and a low correlation the opposite. This yields a coefficient of 0.432, which represents a moderate correlation.
This analysis shows that the team responsibility adjustment likely has a disproportionately large impact on the metric in general, but in what direction is this impact taking the metric? In other words, is team responsibility itself strongly correlated with deterring ability? Because if this is the case, it will only further exacerbate the problems already presented by this part of the formula. Moving away from my metric, we can try to quantify this relationship by taking the correlation between team responsibility and other metrics. The correlation between responsibility and defensive impact metrics gives a coefficient of 0.140, while correlation between responsibility and rim deterrence is -0.070. The fact that these two calculations produce negligible correlations suggests that team responsibility shouldn’t be directly associated with deterring ability, although this doesn’t exactly align with my previous calculations. While the details aren’t the clearest, it is safe to say that the team responsibility adjustment has a larger impact on the data than it likely should.
In closing, the metric that I designed isn’t perfect. If that’s a surprise to you, I wish I had the same level of confidence in myself that you apparently do in me. What I do think this project accomplished, though, was introducing a new way of thinking about defense and defensive analysis. I would love to see more research on how a player’s defensive presence alone can affect a game, and hopefully this paper and others like it will serve as inspiration to build off of this core idea.
Sources
Data: https://docs.google.com/spreadsheets/d/1kWXUFkNLD-t_DbgcVKfYnab5o18xSy6vD7Hqe7huGA/edit?usp=sharing
Sources: NBA.com, basketballreference.com, bball-index.com, espn.com.
Σχόλια