By: Aaron Phung and Matthew Sasaki

Introduction
There are seasons when we feel like a sports team is guaranteed to win the championship no matter what due to the overwhelming amount of strength in their players. We often call these teams “superteams”. However, some of these superteams still find a way to lose a lot of games, and fans are left in shock. It logically doesn’t make sense that even with superior talent on one roster, superteams can struggle to stay in the middle of the pack of their league. There must be some other factors that cannot be seen in accolades or box score stats that account for their disappointing performance.
In this article, we will be determining which 5 NBA teams were the most disappointing since the 2000-2001 season. In addition, we will compare them with 3 successful superteams and determine what factors differentiated the two categories of teams. We will base our comparisons on two statistics: usage rates across all players on the rosters and win share distribution. We hope that this study can elucidate some of the reasons that teams we believed were surefire winners failed to meet expectations.
Methodology
In order to obtain our list of the top 5 failed superteams in the NBA, we compared the betting odds of teams from Basketball Reference before the start of the season to the teams’ actual record that season. The biggest differences between the predicted record and the actual record, in which the predicted record was worse, determined the most disappointing teams. For these 5 teams, we looked at their players’ win shares and usage rates from the previous year and compared them to the year of the team’s most disappointing performance.
Next, we arbitrarily picked 3 superteams to compare with our list. The teams that we chose were: the 2000-2001 Lakers, 2010-2011 Heat, and 2016-2017 Warriors. We will compare the teams on 3 different statistics: usage rates across the team and team win share distribution. Usage rate is the percentage of possessions in which a player contributed to the outcome of the possession. Win shares is a statistic designed to estimate how much a player contributed to the team’s success. We chose these stats to compare because they are great indicators of the team’s chemistry and division of responsibility. For example, an even distribution of usage rates and win shares demonstrates a balanced team in which all players contribute equally to the team’s success. This data will show any differences, if any, in terms of how well the failed and successful teams worked together.

The Failed Teams

Above is a bar graph showing the teams that had the biggest drop in their actual record compared to the predicted record prior to the season. However, the teams that we picked for our list were not simply the top 5 teams on this graph. We also wanted to only consider teams that remained healthy throughout the year. If a team is missing their star player, they are bound to perform worse than expected, and it is not necessarily an indicator of poor team chemistry. Based on these two factors, we decided to include the following teams in our list of the most disappointing superteams: 21-22 Lakers, 08-09 Bulls, 16-17 Rockets, 12-13 Lakers, and 13-14 Nets. The 13-14 Nets not being on this graph shows how many teams fail because of injuries.
21-22 Lakers
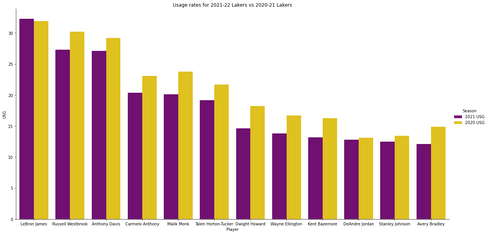
The graphs show the usage rates and win shares of the players on the Lakers roster in the 2021-2022 season. The purple bar represents their stats from the 21-22 season, while the yellow bar represents their stats from the 20-21 season. Interestingly, all of the players’ usage rates decreased except for Lebron’s in the 21-22 season. There is less of a noticeable pattern for the win shares, but one thing to point out is Russell Westbrook’s win shares in the 21-22 season compared to his win shares in the 20-21 season. He was expected to be the Lakers’ third superstar, so the fact that he severely underperformed and cost the Lakers a couple of solid role players is a big reason for the Lakers’ measly 33-49 record.
08-09 Bulls
The Chicago Bulls were predicted to have great success in the 07-08 season. Led by rising stars Ben Gordon and Luol Deng, they also had a defensive monster in Ben Wallace. Unfortunately, these players did not meet expectations. While their usage rates remained relatively consistent, similarly to the rest of the Bulls’ roster, they had the biggest drops in win shares among the entire team. This led them to have a 33-49 record.
16-17 Rockets
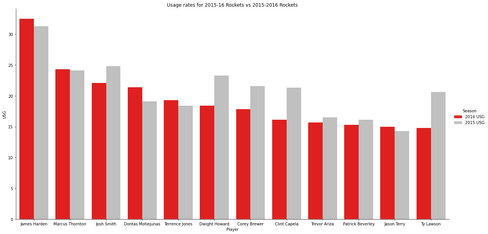
In 2015, James Harden was establishing himself as one of the league’s best scorers. By adding solid big men in Dwight Howard and Clint Capela and a veteran at the wing in Josh Smith, the Rockets seemed to have added some supporting pieces to make themselves title contenders. However, at just 41 wins, the Rockets barely made the playoffs. James Harden increased his already high usage rate even more, but the usage rates of his surrounding stars Josh Smith, Dwight Howard, Corey Brewer, and Clint Capela all dropped. Furthermore, even though Harden’s usage rate increased, his win shares took a big hit.
12-13 Lakers
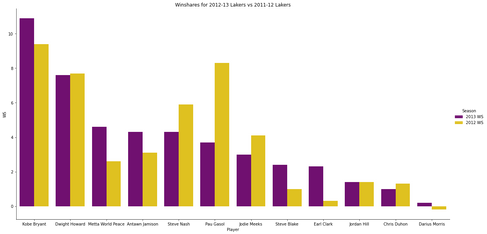
The 12-13 Lakers are notorious for the season that ended with them in the 8th seed. Their starting lineup was composed of All-Stars, so barely making the playoffs was greatly unexpected. While Steve Nash and Pau Gasol missed 32 and 33 games, respectively, the rest of the Lakers’ core players remained healthy. The biggest trend to note in these graphs is how lopsided they are. Kobe Bryant’s usage rate and win shares for the 12-13 season were greater than the second-best player in these stats by over 30%. In addition, Pau Gasol and Steve Nash saw significant drops in their win shares. The heavy load that Bryant carried for the season eventually led to his Achilles injury.
13-14 Nets
The 13-14 Nets was a team full of newly added veterans. The most notable were Kevin Garnett and Paul Pierce, the NBA champions in 2008 on the Boston Celtics. Joe Johnson, Deron Williams, and Brook Lopez also brought experience and skill to the other positions. This lineup seemed well-rounded and unbeatable. However, the season did not pan out as expected. The Nets’ core Kevin Garnett, Paul Pierce, and Deron Williams saw significant decreases in their win shares from the previous season. In addition, all of the major stars on the team decreased their usage rates significantly. The recent addition of too many players could be the reason the Nets failed to reach their goals.

Successful Teams Usage Rates and Win Shares
10-11 Heat
The 10-11 Heat was a very successful team in the regular season with a record of 53-29. Looking at these graphs, we see a heavy reliance on the “Big 3” of the Heat: Lebron James, Dwyane Wade, and Chris Bosh. Their usage rates and win shares are significantly higher than those of the rest of their teammates. In other teams like the 21-22 Lakers, this strategy would not work. However, because the Heat were fortunate enough to have all 3 core members remain healthy, this strategy was enough to secure them the best record in the East.
16-17 Warriors
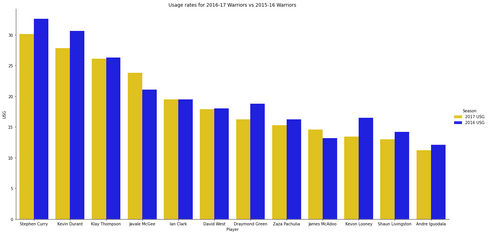
In the year previous to the 16-17 Warriors, they had the best record in NBA history. Adding Kevin Durant to their roster strengthened their team even further and helped them cruise to a title this year. The significant drop in win shares in all of the Warriors’ top 4 players may cause people to think that the team worsened after adding Durant, but this is because Kevin Durant was a new addition to the team, so win shares had to be distributed between more stars. Their usage rates surprisingly all remained very similar to the previous years. Being able to maintain high usage rates among all players even with the addition of another superstar signifies that the roster was still very involved and did not leave the majority of the work to just two or three guys.
00-01 Lakers
There is no doubt that the success of the 2000-2002 Lakers dynasty relied heavily on the dominance of Shaquille O’ Neal and Kobe Bryant. This is reflected in these graphs. The usage rates for both players surpass 30%. In addition, their win shares are significantly higher than the rest of their teammates. Not all teams that rely on 1 or 2 superstars work out, but considering the number of stats both players were producing, this was a viable strategy that led them to a 3-peat.

Conclusion
The data shows that there is no one formula for winning an NBA title. For example, in the 21-22 Lakers, 16-17 Rockets, and 12-13 Lakers, they relied heavily on one or two superstars to carry their team and found little success. However, the 00-01 Lakers and 10-11 Heat used the same strategy and ended up at the top of the league. The other failed superteams we looked at, the 13-14 Nets and 08-09 Bulls, had a more balanced playstyle. The 16-17 Warriors had a similar usage rate distribution as these teams but had one of the strongest lineups in NBA history. In order to build on this data in the future, we would like to look at the players’ stats and plot them next to their usage rates in order to gauge their efficiency. In addition, we would like to look at assist percentage as an indicator of team chemistry. Even if we do look at these stats, however, we still believe there will be no clear pattern that differentiates successful and failed superteams. There are many intangibles not tracked by statistics that can affect a team’s success.
Sources:
Basketball Reference


Commenti