By: Victor Li

Premise
Professional League of Legends is one of the largest esports in the world. One of the most important parts of any professional League of Legends game is the draft, where teams systematically select which champions (characters) they will play and which they will forbid the opponent from playing. The selection of these champions are commonly referred to as “picks,” and how strong people perceive a champion to be drastically impacts how often they are picked. Oftentimes, empirical win rate (percentage of how much a champion wins when it is picked) is cited as a simple, one-number, “top-down” metric that reflects champion performance.
Recently, however, prominent League of Legends figures such as former coach “LS” and current streamer “IWillDominate” have criticized the use of win rate to measure champion success, especially in competitive play. LS and IWillDominate claim that these win rates lack context, as they don’t capture how well these champions are actually being utilized in-game.
What are we going to do, then?
So, we will attempt to add context by adjusting for the different factors that go into champion success. To start, every League of Legends game is played between two teams. If one team is stronger than the other, they will naturally be expected to win, even if their champions are worse. In addition, League of Legends teams are composed of five players who all play different champions. Therefore, a champion’s win rate can be inflated if it is always picked with four other strong champions. Likewise, a champion that carries otherwise weak team compositions could have a “true” win rate higher than we may think.
Now, any kind of simple, one-number metric is bound to leave out huge amounts of context; this is just something that comes with condensing so much information into a single value. There’s also the “bottom-up” approach, in which many different aspects of a champion are given a certain value and summed up to create their overall power level. This is what analysts like LS and IWillDominate frequently do. However, there are a couple issues with this approach:
Most people don’t have the in-depth knowledge of the nuances of professional League of Legends required to actually make such a statistic.
It can be subjective; what aspects should be valued more than others? Do we favor lane-dominant carries like Jayce or teamfight-oriented champions like Ornn? It’s hard to tell what actually matters when it comes to winning games.
League of Legends has 5 completely different roles (Top, Jungle, Mid, Bot, and Support) that each influence the game in different ways, so the “formula” for a bottom-up statistic may have to change depending on the role (or the meta).
With this being said, our attempt to estimate champion power level will be to use the one-number win rates; however, we will provide context to them by accounting for who the champions are picked with and who they are picked against in every single game they are played.
For each game, we can add up the value of each champion and the team on the winning side (all represented by variables that we will later solve for) and subtract those for the losing side. The result should be equal to the value of one win. Note that using team strength is the simplest remotely reliable way of estimating the strength of the players that are using the champions, since League of Legends teams don’t change roster very often.
If we do this for a bunch of games, we get a huge linear equation that we can perform a regression on. Then, by converting value into win rates (using 0 net value = 50% win rate as a benchmark), we can estimate the true win rates of champions and teams.
The Results
To preface, it should be emphasized that these results are estimations. It’s hard to use them to come up with any definitive claim about a champion or team, but we can use them as tools to better understand and contextualize the performance of these champions and teams.
We used game data from the 2021 spring regular seasons of the LCS(North America), LEC (Europe), and LCK (Korea), 3 of the 4 largest international competitive regions for League of Legends. Doing so, we get the following results.
Here are some graphs to help visualize them (note that the red line is for when the true win rate equals the observed win rate):


We can see that champions and teams, for the most part, don’t have wildly different win rates when we adjust them. However, there are quite a few standouts. The champion that fell the most when we adjusted the win rates was Miss Fortune, who went from an unimpressive but not terrible 42% win rate to a measly 13% true win rate. The champion that stands on the top of the true win rate mountain is, without a doubt, Cho’Gath, who won in 9 of 12 of the games in which he was picked but may even be underrated by this 75% win rate because he won with teams like FlyQuest (33% win rate, 30% true win rate) and Excel (39% win rate, 27% true win rate), bringing him to an 81% true win rate.
We can also see a couple of general trends from the data:
Takeaway 1: Popular Champs are Underrated by Win Rate
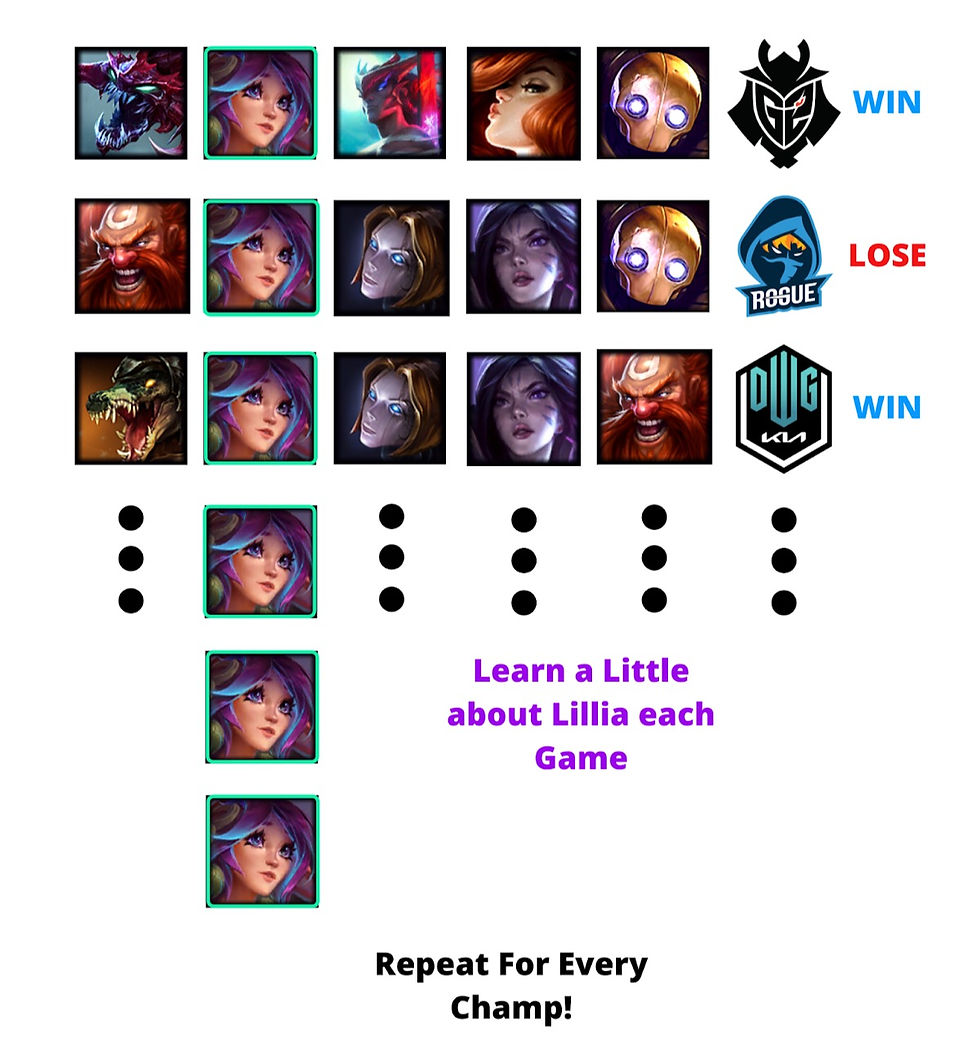
The “How Much Win Rates Changed” graph displays one major trend. The champions that were picked more tended to have higher true win rates than empirical win rates, often by massive amounts (especially Lillia, Hecarim, and other strong junglers — we’ll get to them in a moment). This actually makes sense, as strong champions were often picked with champions that didn’t always fit with them and were often piloted by players of varying degrees of skill. This inherently means that they were put in worse situations, so their true win rate should be higher than their empirical win rate. This supports the idea that high pick rates show that a champion is powerful, even if the win rate is not always very high. On the flip side, the seldom-played champions (5 to 20 games) in general had lower true win rates than win rates. The opposite process seems to be happening here: unpopular champions are generally boosted by stronger players, better teammates, and easier matchups (which means weaker enemies on average), since there would otherwise be no reason to pick them over the popular ones.
Essentially, the differences in performance we see between popular and unpopular champions remind us to not overreact to high win rates from niche champions and low win rates from prominent champions. Maybe more importantly, it suggests that play rate is actually an important statistic that isn’t just an appeal to authority; rather, it can actually be used as meaningful and legitimate evidence toward champion power.

Takeaway 2: Jungle Diff (High Impact)
Largest increases from Win Rate to True Win Rate (Min 10 games played):
(Junglers in Green)
If you’ve played or watched League of Legends in 2021, you probably know how impactful the jungle role is. If you haven’t played League, the jungle is the role that runs around the map and clears monsters, whereas the other roles spend most of their time in specific lanes. It seems like every professional game revolves around how much farm and exp the jungler can get, not to mention how much pressure they can exert by ganking lanes (helping other teammates by attacking the opponent they are matched up against) and controlling neutral objectives. This is seen in the data. Out of the 7 largest increases from empirical win rate to true win rate (out of the champions who were picked at least 10 times), 5 of them were junglers: Graves, Dr Mundo, Udyr, Hecarim, and Lillia. In fact, popular jungle champions across the board saw much higher true win rates than empirical win rates, more so than other roles. Out of the 5 mentioned earlier, all but Dr. Mundo were incredibly popular junglers, comprising 4 of the 6 most picked jungle champions. The other two are Olaf and Nidalee, who still saw significant increases in their win rate when we adjusted them, both ending up with very high true win rates of over 60%.This signifies the overall influence of the jungle role, suggesting that the role itself contributes more to winning than the other roles (rather than the a few particular jungle champions just happening to be especially powerful).
It should be noted that part of the large increases in win rate from champions like Lillia (the most picked jungler by far) and Hecarim (4th most picked) is because they were usually picked against other strong junglers (League of Legends teams just don’t concede hard-losing jungle matchups in the current meta). This means that they were inherently going up against strong competition, thus inflating their own value in the analysis we performed. Of course, their increased value also increases the value of competition, in a sort of positive feedback loop that ends up with higher true win rates across the board.
If I were to hazard a guess, I’d say this positive feedback loop has overrated some of the junglers. Lillia, Hecarim, and Udyr, according to most analysts, were extremely powerful champions; almost no one truly believed that their middling win rates (47%, 51%, and 50%) were actually indicative of how good they were. However, the fact all of them ended up with near 70% true win rates (67.4%, 69.8%, and 66.3%) seems suspicious, as it’s hard to believe that any champion should be around twice as likely to win as they are to lose. Most likely, their prevalence and popularity meant all those factors we discussed that affect popular champions’ true win rates (especially the positive feedback loop for popular junglers) affected them more than almost anyone else. This, in addition to the fact that these champions were probably genuinely overpowered, led to such insane true win rates.
As a final note for this takeaway, Taliyah was actually the jungler with the highest true win rate (79.6%). She was also played in 39 games, meaning that there was a decent sample size. Her empirical win rate was already over 74%, so she was most likely given a little boost by our analysis process by virtue of being a jungler. Other than that, however, her win rate seems pretty similar to her true win rate, so our analysis doesn’t tell us anything extra about Taliyah like it does the other popular junglers.

Takeaway 3: ADCs/Marksmen (Low Impact)
Largest decreases from Win Rate to True Win Rate (Min 10 Games Played):
(ADCs/Marksmen in red)
On the flipside of things, almost all popular ADCs saw drops to their win rates when we adjusted them. ADCs/Marksmen are a certain type of champion that are commonly seen in the bot lane role. They deal consistent damage from a distance but often don’t offer much else. Miss Fortune is one of them, and we’ve already discussed her abysmal estimated true win rate. This was most likely due to the fact that she was one of the champions that was very strong early in Spring but who became a lot worse almost immediately. Jhin was a similar story: incredibly powerful with the Galeforce item early on but got phased out of the meta relatively quickly once the item was nerfed (intentionally made weaker by game developers), resulting in a low true win rate. It’s possible that some teams mistakenly thought Jhin and Miss Fortune were still strong and kept on playing them after they got nerfed, resulting in a low true win rate. Still, in these cases, being a huge part of the game for such a short period of time means that true win rate likely isn’t too useful, as the power level of the other champions when they were strong is far different from the power level of the champions for the rest of Spring. Our method of estimating true win rate relies on the strength of other champions to add context, so this could very possibly have introduced inaccuracies.
However, the list of ADCs that saw decreases from empirical to true win rate wasn’t just listed to early-meta powerhouses like Jhin and Miss Fortune (meta, or most effective tactic available, refers to the champions, items, playstyles, etc. that are deemed to be the most effective at the current moment by players). Kai’sa was the most picked of any champion, with a whopping 261 picks (168 more than 2nd place Alistar). As discussed in Takeaway 1, we should then expect Kai’sa to have a higher true win rate. However, she had an estimated true win rate of 35% (from an empirical win rate of 48%). Out of the 31 most picked champions, Kai’sa is one of only three champions to see a decrease in win rate of over 10%. The other two are Xayah and Senna, two other marksmen. A few rarely picked (and often situational) ADCs, like Sivir and Varus, had relatively high estimated true win rates, but virtually all of the popular ones were not treated kindly at all by the data. And, out of the 12 champions with the largest decreases from win rate to true win rate, 8 of them were ADCs (this includes the popular Kai’sa and Xayah but also the less common Vayne and Kalista).
Yet, it seems like the underperformance of the ADCs is a result of their role, rather than the champions themselves. Most ADCs find themselves in the bot lane. So, while the jungle role cemented its high impact in our analysis, it seems like the bot lane role did the opposite. The same positive feedback loop for prominent champions that we saw from junglers applied here, only in reverse because the bot lane role was seen as weaker in general. In fact, the ADC with at least 10 games picked that had the highest estimated true win rate was Lucian, an ADC who actually spent almost all of his time in the mid lane. There isn’t a huge inherent difference between Lucian and all the other ADCs; rather, it seems like the fact that he wasn’t being played in the bot lane was what made the difference.
As for why the bot lane was seen as having such little impact, we can surmise that the team-dependent nature of the role is a potential reason. In the laning phase (first part of the game, when the players on each team tend to be spread out), bot laners are paired with supports, and it is often these supports (not the bot laners) that dictate the laning phase. In addition, in late game teamfights, bot laners often depend on their teammates to keep them alive so they can safely damage the opposing team.
Takeaway 4: Teams Don’t Change Much (Except CLG)
For teams, the gap between the estimated true win rates and their actual win rates essentially arises from their drafts (what champions they picked) and the drafts of their opponents. While we can’t judge drafts directly from the analysis we have done, we can estimate the combined strength of the champions that were picked using estimated true win rate. This completely ignores synergy and champion interactions, a huge weakness for this approach. So, the following analysis is tentative and should be used as a general in-the-ballpark tool, rather than a measuring stick. With that being said, we will assume the following:
A team that consistently has better drafts than their opponents will end up with a higher win rate than what their true win rate may be, and the opposite is true for teams that draft poorly.
Overall, the win rates of the teams didn’t change much when we adjusted them. Damwon KIA was the best team in these 3 regions and had the highest true win rate out of any team or champion (except for King Cho’Gath). In general, the teams that won the most had the highest true win rates, and those that lost the most had the lowest true win rates. A notable exception is Counter Logic Gaming, who was already one of the worst teams in their region yet was estimated to have strong drafts that meant their performance was even worse than their record showed. In general, the lack of extremely good or extremely bad drafting teams (according to the data) can be attributed to the fact that each team picks 5 champions in a game. It is unlikely that the draft gap between any two teams in a game is as large as the individual gap between two champions may be (essentially, there are consistently more champions to “average out” the strong and weak champions that are picked).
Surprisingly, the teams who had the best draft solely based on our limited analysis were Counter Logic Gaming, Excel Esports, and Fredit BRION. These were all bottom-tier teams in their own regions, suggesting that they were intrinsically worse teams that had to look for any opportunity (such as better drafts) that they could take advantage of in order to come up with the few wins they could manage. Outside of these 3, G2 Esports seemed to have the best drafts.
On the other side of things, our analysis suggested that TSM had the largest increase from win rate to true win rate and thus sported the worst drafts in all 3 regions. TSM’s draft struggles have been an ongoing theme over the past few splits, to the point where they’ve almost become a punching bag in this regard. This data certainly supports that sentiment, although we should again note that this drafting analysis is largely incomplete. (As a side note, Damwon Kia, the reigning world champions, actually had poor drafts according to our model).
Conclusion / Further Improvements
Looking at the data, it seems clear that role plays a massive part in the impact of a champion in League of Legends. The data shows that strong junglers, at least in Spring 2021, tended to be even better than their win rates suggested, while the opposite was true for champions played in the bottom lane. There are also many ways that the analysis could be extended in order to make it more accurate. We could use results from more regions, such as the LPL (China), as a large sample size is incredibly important for regressions on game-level data (note all the wonky noise for champions who weren’t picked often). Also, because we have seen the major differences in influence level between roles, it would be interesting to play around with the weight of each role in our regression. Finally, this analysis completely ignored bans, a major part of the drafting phase. Bans allow you to prohibit both you and your opponent from picking a certain champion. Bans weren’t included because all they do is change the result of which champions are picked, so their impact is already accounted for by looking at which champions are picked. However, it could still help to quantify this impact to get a better understanding of how bans relate to how good champions are. It’s also possible that they prevent the opponent from building strong synergy between the champions they picked, or that they stop the opponent from picking champions that are especially good in specific games. Such factors would not be captured by the analysis we did at all, and although it would be hard to quantify these areas of impact, it could still be useful.
Kommentare