


LeBron James: Which Era is His True Prime?
- Bruin Sports Analytics
- Dec 25, 2023
- 8 min read
By: Brian Mualim

Introduction
In any sport, a player’s prime is defined as the peak their career. Due to basketball’s unforgiving nature as a sport, where the slightest misstep could injure and derail your whole career, a basketball player’s prime usually lasts around 5 years. We see this phenomenon happen in superstar caliber players like Russell Westbrook and James Harden, both of whom were superstar players who had their prime during their time in OKC Thunder and the Houston Rockets respectively, and experienced a decline in production as soon as they left those cities.
However, one man stands above all in this regard: LeBron James.
LeBron James has been the best player on every team he’s been on since his rookie season in 2003. With the 2023-2024 NBA season underway, it doesn’t look like he’s stopping anytime soon as he continues to dominate the floor as the Los Angeles Lakers’ star player. As he continues his tradition of topping the ”NBA Top 100 Players list” for two decades, it begs the question: which years of LeBron’s career was his true prime?
Background
To examine the anomaly which is LeBron’s career-long prime, we will be breaking down his career into his tenure across the four different teams he’s been on (he was on Cleveland on two separate occasions). The goal of this project is to examine which version of LeBron was the best out of these four options. We will be using a mixture of basic and advanced statistics and assign a score to determine certain aspects of his game, such as scoring, passing, defensive ability, etc.
Methodology
We selected these eras based on the four teams he has played for as he’s been on each one for a minimum of four years. This provides us a good sample size of his production during that time.
Era 1: 2003-2010 (First Stint with Cleveland)
Era 2: 2011-2014 (Miami)
Era 3: 2015-2018 (Back to Cleveland)
Era 4: 2019-2023 (Los Angeles)
Metrics Used:
Basic Statistics
PPG - points per game
APG - assists per game
TRPG - total rebounds per game
SPG - steals per game
BPG - blocks per game
Supplementary Statistics
Games played per year
EFG% - Shot efficiency that takes into account whether a shot is a 3 pointer or a 2 pointer
We will not be considering the 2023 - 2024 season as it’s currently only been about 20 games into the season as of the time of writing, and we don’t have a big enough yet sample size of LeBron’s performance this year.
Scoring System
For the basic statistics, we’ll be comparing LeBron’s data to that of an average player’s. We’ll be taking the z-score of LeBron’s data and measuring it on an absolute scale out of 10 which will be determined in each category’s analysis. This will ensure that years in which LeBron overperformed or underperformed in contrast to the rest of the league will be taken into account in our findings.
Z-score formula: (LeBron data - mean) / standard deviation
Actual Score formula: (z-score /3.5) * 10
For the supplementary statistics, I’ve decided to give games played and effective field goal percentage a total of 5 points each.
Games played will be calculated by the formula: (LeBron Data / 82) * 5
EFG% will be calculated by the formula: (LeBron Data / 1) * 5
In total, there is a maximum of 60 points that the Lebron from each era can obtain from this ranking system.
Analysis: Basic Statistics
PPG:
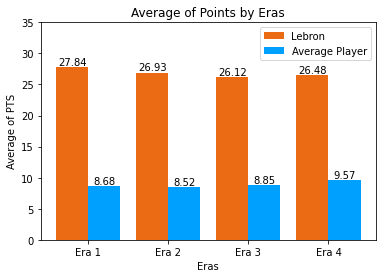
Points are arguably the most important statistical metric in basketball as it determines which team would go on to win the game. Though LeBron is often called a pass-first player, he had just recently broken Kareem Abdul-Jabbar’s 39-year-old scoring record on February 7, 2023. Here, we take a look at LeBron’s career distribution of points per game:

As we can see from the scatter plot, LeBron has only ever had one season where he averages less than 24 PPG, which was his rookie season. Despite this, the era in which he scored the most points was actually during Era 1, his first stint in Cleveland. There may be a couple of factors attributing to this, namely due to the Cleveland front office not providing him with any other proficient scorers during that time (his highest scoring teammate during those 7 years was Mo Williams with 17.8 PPG in 2009), as well as his high usage rate which had him playing over 40 minutes per game.


APG:
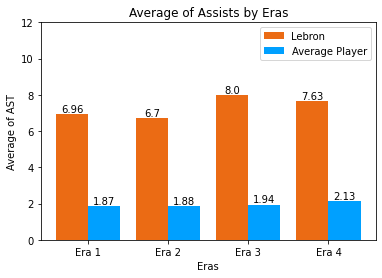
A big reason why LeBron’s style of gameplay is so hard to contain is his ability to make the right play, which means finding an open teammate to pass to instead of forcing a contested shot. He’s known for assuming the point guard’s duties and being the primary ball-handler of his team, even though his usual position is as a Small Forward.

His lone season at averaging over 10 assists per game was coincidentally the same season in which he won the only assists title of his career. From the scatter chart, we can observe that his APG remained consistent between his first 2 eras, which then steadily increased and peaked during the 2019 - 2020 season. Since then, he has averaged between 6 - 8 assists per season once more, similar to his first 10 seasons in the NBA. It’s also interesting to see how the increase in the game’s paces contributes to stats inflation for assists, as the average player’s assists jumped from 1.87 APG to 2.13 APG in a matter of 15 years.


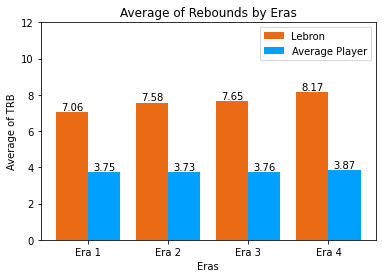
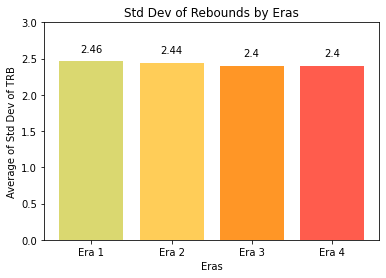
TRBG:
Rebounds have always been an integral part of the game. Defensive rebounds lead to the start of your team’s possession, and offensive rebounds give the team a second chance at scoring points. As a 6’9” small forward, it’s part of his role to box out opponents and secure rebounds for his own team.

As we can see from the bar charts below, we can see that oddly enough, LeBron has gotten better at rebounding as he aged. This could be attributed to the fact that in his later seasons (around Era 3 and Era 4), he spent some time in playing Power Forward and Center positions as opposed to his usual Small Forward position.


SPG:
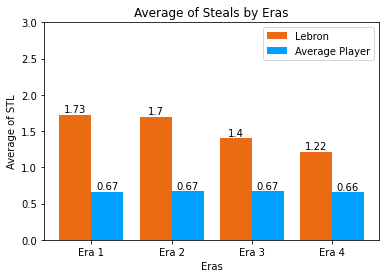
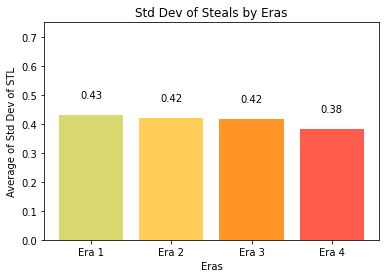
So far, we’ve explored James’ prowess on the offensive side of the game, it’s time we take a look at his defensive abilities this time around. An underrated aspect of LeBron’s game is his intelligence, with coaches and players alike recounting stories of LeBron being able to recognize their team’s playbook and strategies. His ability to read passes, as well as his freakish athleticism and reaction speed would allow him to garner at least 1 steal per game throughout every season of his career.

From the chart above, we can observe a steady decline to LeBron’s steals production as he aged. He went from averaging about 1.75 SPG during the first two eras of his career, to just shy of the 1.25 mark during his time in Los Angeles. This is likely due to the factor of age and decreased minutes. I predict that this number will continue to decline in the upcoming season(s). Interestingly enough, the average player’s SPG remained stable throughout the years.


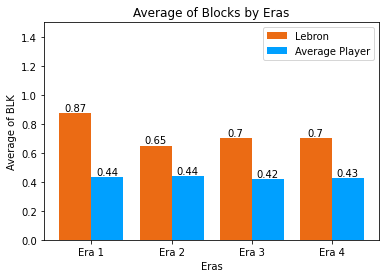
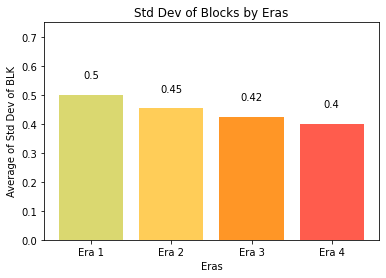
BPG:
As we’ve mentioned before, LeBron stands at 6 foot 9 inches, which means that he is on the taller side of NBA players. Combined with a 7 foot wingspan and a vertical jump of 44 inches, LeBron is known for his chasedown blocks on unsuspecting players going for their layups. The statistics are as shown below:

By far, this is LeBron’s most inconsistent statistic. We see a major drop off in blocks production after his first stint in Cleveland, with majority of his seasons coming out at roughly 0.6 BPG; however, there are several seasons such as 2013-2014, 2017-2018, and 2021-2022, which has his BPG at 0.3, 0.9, and 1.1 respectively.
This decline in blocking can be attributed to not just age and lack of playing time, but also lack of effort on the defensive end of the ball. During this time, several clips of LeBron not rushing back on defense after an offensive possession emerged, which drove the narrative that he doesn’t exert as much effort on defense as offense. As can be seen from the statistics above, the narrative holds some weight.


Analysis: Supplementary Statistics
Games Played:
LeBron’s consistency in playing at an elite level, and the longevity of his career, is something that’s unprecedented in NBA history. Nevertheless, all good things must come to an end, as LeBron continues to face multiple injuries within recent years, limiting his playing time significantly. It’s also important to note that the 2011-2012 season consisted of only 66 games due to a shortened season, and the 2019-2020 season consisted of only 72 games. Both of these have been taken into consideration when taking the average of games by eras.

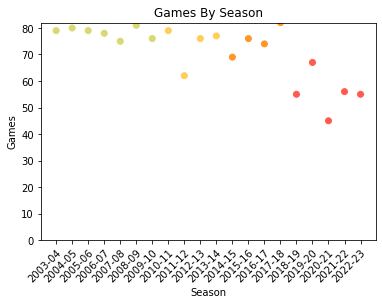

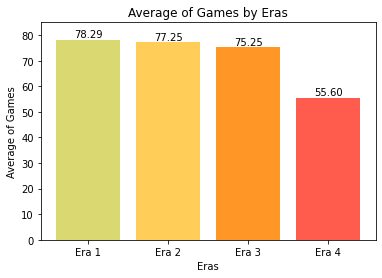
As can be seen from the graphs above, the average games he played each year remained fairly consistent within the first 3 eras. Over the first 15 seasons of his career, LeBron missed 71 games and suffered no major injury, and even played a full 82-game season on his 15th season.
Unfortunately, he would be riddled with injuries during his fourth era, missing 122 games out of 400 possible games during his tenure in Los Angeles. These injuries would vary from soreness, muscle pulls, and his most recent foot tendon injury that made him miss considerable time in the 2022-2023 season.

EFG%:
"eFG%" is an advanced statistic that measures a player’s true efficiency in scoring. It’s formula is given as (2FG + 1.5 * 3FG) / FGA where FG is Field Goals and FGA is Field Goals Attempted. This metric helps with reducing the bias for an increase of 3 point shots during the 2010s and 2020s, as compared to the 2000s where mid range shots were more popular.

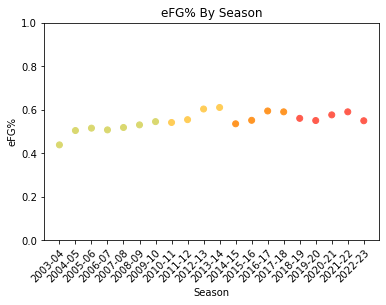

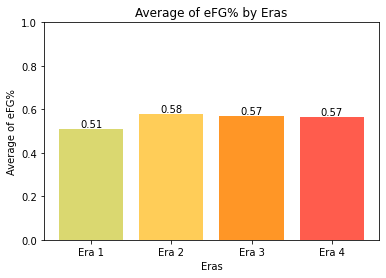
From the charts above, we can make a couple of assumptions of the evolution of LeBron’s playstyle during this time. As we mentioned earlier, LeBron is a pass-first player and would try his best to not force his shots given the opportunity; however, during his time in Cleveland, he wasn’t provided with teammates who specialized in scoring, leading to him having to try contested shots more often. After his transfer to Miami, there was a trend in which teams would build rosters around LeBron’s playstyle, as well as pair him up with All-Star caliber players in order for him to bring championships to the team. This would lead to an increase in eFG% as better teammates would give him more options to either pass the ball when contested, or hit an open shot.
Another possibility is that he simply trained how to shoot better. As a raw high-school prospect with explosive athleticism, LeBron may have relied on his driving ability more during his first few years in the NBA, and eventually developed a jump shot once he realized that having a shot package would allow for more opportunities at scoring the ball from different ranges.

Conclusion
Our results are shown as below:

In summary, our analysis has unveiled that LeBron James' prime, as defined by scoring efficiency, steals, and blocks, aligns most prominently with Era 1, spanning his initial tenure in Cleveland from 2003 to 2010. This period showcased a remarkable balance of offensive prowess and defensive contributions. Nevertheless, it's worth noting the tight competition between Eras 1, 2, and 3, underscoring LeBron's exceptional consistency throughout his career leading up to his time with the LA Lakers.
This analytical approach could potentially serve as a valuable tool for evaluating the prime performance of other basketball legends who sustained elite-level play over extended periods, including iconic figures such as Michael Jordan, Kobe Bryant, and Kareem Abdul-Jabbar. By applying a quantitative lens to their respective eras, we may gain deeper insights into the nuanced dynamics of their careers and the enduring impact of their prime athletic performances.
Reflection
Honestly, I’m quite surprised by the results as people always assumed that Miami Heat LeBron is the prime version of him, but according to this statistical research, that wasn’t the case. The results were also much closer to each other than I imagined.
Of course, this method isn’t foolproof by any means. It doesn’t take into account playoff success, personal accolades, and other advanced statistics such as VORP, PER, RAPTOR, and Win Shares. What it does offer, is a peak in how raw statistics without context can be interpreted entirely differently than what is accepted by society.
Improvements to this method could include a weighted average of each statistic based on some coefficient determined by how much each statistical metric impacts a game’s outcome through linear regression.