By: Marcus Orwin and Caden Tien

On October 29, 2021, Ian Anderson was dealing. The 23-year-old Braves pitcher had carried a no-hitter through 5 innings in Game 3 of the World Series, stunning Astros hitters along the way. Throughout most of baseball history, this would have been a chance at glory – if Anderson could hold on, he would have thrown just the second ever no-hitter in the World Series. However, Anderson was pulled from the game. Braves relievers would hold the Astros to only 2 hits and no runs, throwing a shutout and contributing to Atlanta’s eventual victory. Still, the decision to remove Ian Anderson would have been highly unusual in most years, but not in 2021 – rather, it’s a result of a steady increase in reliever usage and, resultantly, a decrease in reliance on starters.

There is a clear positive trend in relievers pitching more innings now than they have ever before. We mainly see this shift happening in the last decade, with the importance of the starting pitcher becoming less and less relevant as the years go on. The graph below displays the percentage of innings pitched by starters and relievers from 1981 to 2021. The percentage of innings pitched by starters decreased by over 10% from 2011 to 2021, which is huge, considering from 1981 to 2011, the percentage had only decreased by just over 2%. Such a substantial jump can be attributed to many different variables, namely a new era of managers in the league, or new strategies being used by managers to keep their pitchers healthy or ready for the playoffs.


The increase in reliever usage is a big part of the game in Major League Baseball today, and has employed many new strategies for different teams. The constant changing of relievers throughout the decade even caused MLB to create a new rule to help prevent managers from using so many pitchers and to improve the pace of play. This is known as the three batter minimum rule, where every relief pitcher that comes into the game has to stay for a minimum of three batters, or until the inning is over, with exceptions for injuries and illnesses. This is a change that could not have been imaginable just 10 years ago, but due to the dramatic change in the role relievers now play in the game, MLB thought it necessary.
As is clear, starters have had their workload decreased, and as a result reliever usage has increased rapidly both in terms of innings pitched and number of pitchers used. However, this does not necessarily imply better performance overall. A quick look at the correlation between reliever usage and team pitching WAR (wins above replacement) is revealing – there’s a fairly weak correlation between innings pitched by relievers and total WAR (0.27). There’s so much variance when it comes to the teams with the highest reliever usage – the Rays, who had one of MLB’s best pitching staffs this year, are in first by a decent margin. However, right below Tampa Bay is a collection of some of the worst teams (Orioles, Pirates, etc.). It should be noted that this metric is probably too simplistic. After all, it makes intuitive sense that teams with poor rotations would need to pull starters sooner as they perform worse, and this variable would be impossible to separate from general strategy. Still, it’s interesting that the Rays and White Sox were two of MLB’s best pitching staffs, with the former using relievers more than any other team and the latter using them less than most teams.

We can dive a little deeper into this data. Since total team WAR includes starters, perhaps isolating reliever statistics would reveal more about the utility of increased relief usage. However, since WAR is a cumulative stat, a rate statistic such as ERA may be more useful.

Keeping in mind that a lower ERA is better (fewer earned runs), the mild negative correlation (-0.15) reveals bullpens that had a higher workload tended to perform better, though this is not universally true. At first this might seem contradictory – basic intuition suggests that individual relievers pitch worse when required to appear more often, as their health diminishes more quickly. At the same time, managers with a better bullpen may push them to pitch more often, and these two factors are contradictory. Equally important is the fact that teams which employ a strategy of high reliever usage are also more likely to send players back and forth between the minors and majors, which in turn keeps their available relievers fresh. Overall, although relievers having a higher workload does not guarantee better performance, it’s certainly not a hindrance.
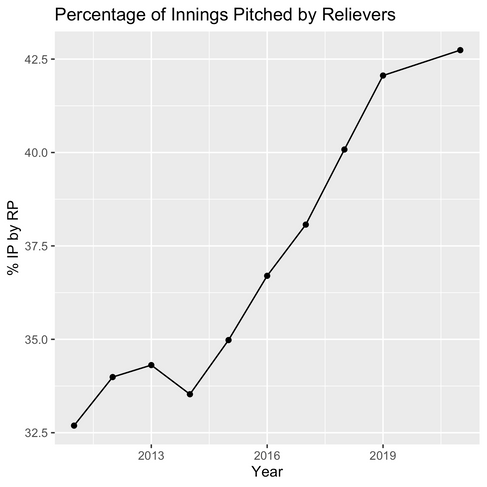
Although some may think that this could be a problem systemic to baseball as a whole, others believe that the managers who have just recently come into the game are the ones changing the way we utilize starters and relievers. The most popular example of this has to be the Tampa Bay Rays and their manager Kevin Cash. Kevin Cash was hired as the Rays manager prior to the 2015 season, and in the time since he has been there, the Rays have turned into one of the most reliever-heavy teams in baseball.

The red line indicates the percentage of innings pitched by Rays starters since 2015, while the blue line indicates the percentage of innings pitched by Rays relievers since 2015.
In 2015, the percentage of innings pitched by Rays starters was 62.94%, compared to only 42.55% in 2018, and 51.71% in 2021. The dip in 2018 could also be attributed to the Rays’ use of openers, or relievers who start the games as starters, but only stay in for the first one or two innings. Although this is a shocking idea, the Rays have also been one of the most successful teams in baseball throughout this time, making it to the ALDS in each of the past three years as well as the World Series in the shortened 2020 season.

Of course, one of the first concerns that come to fans’ minds is the implication this trend may have on postseason baseball, both for their favorite teams and the league in general. Before analyzing these potential implications, it should be noted that postseason baseball has always been different in significant ways. One example that goes back decades is the use of traditional starting pitchers in relief – fans may remember Red Sox ace Chris Sale closing out the 2018 World Series, for example. Even though the game is quite different in October, it’s still possible to compare reliever usage. According to Baseball Reference, 5.46 pitchers were used per game in the 2021 postseason (per team), compared to 4.58 pitchers in 2012. Both of these numbers are higher than in their respective regular seasons (4.43 in 2021 and 3.99 in 2012), but crucially there were 23% more pitchers per game in the 2021 postseason compared to only 14% more pitchers in 2012. Thus, while more pitchers are being used in general, this number is growing at an even faster rate in the postseason.
Note: One explanation for a higher number of pitchers being used in the postseason is that teams generally use five-man rotations in the regular season and three-man rotations in the postseason, leaving 2 extra pitchers to be used in relief.

While it’s possible that MLB’s recent trend toward relievers will be a blip in baseball history, as time goes on it seems more likely that this increase in usage will either be sustained for years to come or even continue to increase. After all, an average of fewer than 2 pitchers appeared in each game for the first 50+ years of MLB’s existence, so this smaller trend is part of a much larger one going back decades. Either way, it will be interesting to see how teams adjust their strategies, as well as what the long-term consequences of this trend may be.