NBA Hustle: A Deep Dive
- Bruin Sports Analytics
- 4 days ago
- 11 min read
By: Grant Boydell and Lucas Pichardo

Introduction:
While basketball coaches preach a variety of different concepts, one is consistently harped on at all levels: hustle. Coaches love players that “do the little things”, such as playing hard defense, boxing out, and grabbing loose balls. Unfortunately, players that hustle in the NBA fly under the radar of the public eye. We hypothesize that there is an association between hustling and winning in the league. By conducting data analysis on the NBA’s hustle stats, we plan on shining a light on the important attributes of hustling in the NBA, and bring certain players to the forefront that exhibit strong tendencies to hustle, all through a statistical lens.
Terminology:
Hustle can be challenging to define statistically, since it is difficult to measure effort. Additionally, an interpretation of “hustle” can differ drastically person to person. Luckily, the NBA tracks “hustle stats.” These stats include deflections, loose balls recovered, screen assists, charges drawn, and box outs. These six statistical points will be our means of investigation. Below will be definitions of each stat to provide a clearer understanding of what we are analyzing.
Deflection (DEF): When a defensive player is able to make contact with the ball, excluding shot attempts
Loose Ball Recovery (LBR): When a player is able to gain possession for his team during when a ball is considered “loose” (no team has possession of it)
Contested Shot (CS): When a defensive player is with 3.5 feet of a offensive player when the offensive player takes a shot
Screen Assist (SA): When an offensive player sets a screen for a teammate and that teammate is able to score soon after using that screen
Charge Drawn (CD): When a defensive player forces a charge foul on an opponent
Box Out (BO): When a defensive player is able to prevent an offensive player from getting a rebound by making physical contact with him
Methodology
Although per 36 minutes stats would address any discrepancies in terms of equal opportunities for players to hustle, we decided to stick to per game statistics in our analysis. Essentially, we want to see who’s influencing the game the most from a hustle-stats standpoint.
We created a hustle metric that gives each player a rating based on per game statistics. We put arbitrary values on each statistic, using the following formula for our metric:

We believe that being active on defense, and fighting for loose balls is the most important aspect of hustle. We value drawing charges highly due to the willingness a player exhibits to accept physicality and put their body on the line. Box outs, screen assists, and contested shots are valued at only five percent respectively because a higher proportion would oversaturate our analysis with big men. And while these metrics do exhibit a hustling effort, they are not as impactful as the other statistics. This is largely due to the impact of a player’s position. So, a center like Domantas Sabonis collects frequent box outs, screen assists and contests due to his common positioning in the paint, but we feel this is not a result of his hustle, but more due to the fact that he plays the center position and is guarding players closer to the rim. This is consistent with the data when analyzing those specific stats. Thus, we valued deflections, loose ball recoveries and charges higher than these stats, because these, in general, are not influenced by position.
For individual player analysis, we used the maximum of each statistic as the leader in each category. For example, the maximum of deflections is Dyson Daniels at 6.1 deflections per game. For team analysis, we did the same but with team per game stats. For example, the Oklahoma City Thunder led the way at the all-star break with 21.7 deflections per game. We are only using data up to the all-star break because it serves as a good point to establish a strong sample size and gets rid of the need to constantly update data. While some teams did not play the same amount of games, the per game statistics eliminate the possible disparities in the statistics.
We started our analysis by observing who the hustle leaders are in the NBA. We then chose a player who we predict will win the NBA Hustle Award this year. Our analysis narrowed it down to Toumani Camara and Dyson Daniels, which we will expand upon later. We then looked at team statistics, conducting linear regressions to see the correlations between wins and different hustle related variables (hustle rating, sum of top 3 hustlers on each team, etc.).
Overall, our key takeaways from our analysis include that hustle has less of an impact on the NBA than we expected. Across the board, it does not correlate with more wins and does not correlate with improved player minutes/production. However, our analysis did uncover, unsurprisingly, the association between hustle and defense. Additionally, we discovered the individual teams that rely more on their hustle to produce wins, as well as players who’s game play incorporates their hustling as a way to make an impact on the game.
With the setup complete, let’s dive into the statistics and explore the NBA hustle landscape.
Data Analysis:


Figure 1 Analysis:
These graphs offer a few key takeaways. Three players stand out because of their excellence in a specific category: Dyson Daniels (deflections), Domantas Sabonis (screen assists), and Toumani Camara (charges drawn). Since our hustle rating puts high values on deflections and charges, it’s no surprise that Daniels and Camera will appear in our analysis often. Also unsurprisingly, certain categories are led by different positions. Screen assists, contested shots, and box outs are dominated by bigs. However, because our hustle rating favors players who fly around on defense getting deflections, loose ball recoveries, and charges, bigs like Sabonis, Isaiah Hartenistein, and Brook Lopez have lower hustle ratings than one would expect. It is interesting to see many role players leading the way in hustle categories, like Daniels, Camara, as well as star players who might surprise fans with their hustle, like Paul George and Victor Wembanyama.


Table 1 - 3 Analysis:
Camara and Daniels lead the way in our hustle rating and are our first half picks for the new NBA Hustle Award. Looking at the second table gives us deeper insight to what makes these certain players strong in terms of hustle. It is engrossing to see guys we would expect to hustle such as Draymond Green, Josh Hart and Alex Caruso, but it’s equally as interesting to see players we would not expect to be leaders in certain categories. Paul George, who is known for his scoring and exceptional ball handling, is an elite hustle player. Additionally, a 7 foot 4 center in Wembanyama is surprising to see here, as players of that size are not expected to fly around the court hustling. Comparing this to the per minute hustle leaders, which negates the minutes effect, Alex Caruso tops the leaderboard. This is not surprising since Caruso is the reigning Hustle Award winner who’s minutes has dwindled since being traded to the Thunder. Overall, these tables present the hustle leaders based on our metric and display the stats of each of them. We will compare these strengths in the next section to get a better understanding of these hustlers.


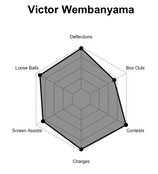


Figure 2 Analysis:
These graphs depict the strengths and weaknesses of a player’s game in terms of hustle. The axis of each string goes from 0 to 100, representing the percentiles for each statistic. For example, Daniels is the 100th percentile in terms of deflections and is about the 50th percentile for charges drawn. When looking at these graphs, we get a better visual of the players, and what makes them good hustlers. We can also see the impact of our specific valuations for the hustle rating, as Alperen Sengun, the do it all center for the Houston Rockets, leads Camara in every category except charges drawn. Yet, Camara has a better hustle rating because of his unique ability to draw charges, a key aspect of our hustle metric. It is interesting to see Sengun’s chart however as it is evident of his all-around hustle. If we set each category equally, we are confident that Sengun will be higher up (see Figure 3). Daniels’ graph shows that he is only leading in deflections and loose ball recoveries yet is still a stronger hustler than players like Sengun. Seeing guys like George, Wembanyama and Sengun here also demonstrate the multi-dimensional aspects of their game, as they are all primarily known for other attributes. While Camara and Daniels may have the strongest hustle rating, we see that players like Green and Sengun are more complete hustlers through these graphs, and are arguably more valuable to a team. We now have a better understanding of players that rely on hustle to help produce for their team, with Daniels and Camara standing out.

Figure 3 Analysis:
We wanted to compare our previous results with a hustle metric where we valued each statistic (deflections, loose balls, etc.) the same, at ⅙. We see that Sengun, as we predicted, is number two on this list. When looking at the top ten, it is strictly big men (power forwards and centers) demonstrating the effect that large discrepancies in terms of screen assists and contested shots can have on our metric. While one may look at the table and claim that big men are better hustlers than guards and wings, the data is impacted by the differences in play styles. These specific stats (screen assists and contested shots) heavily favor big men and create the skew towards players of these positions, which is not an accurate representation of hustle. While still important, the fact that these stats are inflated for power forwards and centers makes it difficult to make claims about the top hustlers in the NBA, based on an equal value system. This is a large aspect of our reasoning to value the specific statistics we did.


Table 4 and Figure 4 Analysis:
Looking back at last year, the 2024 NBA Hustle Award winner Alex Caruso tops our hustle ratings. This not only demonstrates that the NBA values hustle statistics in a similar manner to us but gives us a baseline for predicting future Hustle Award winners. We created the radar chart for Caruso, with his percentiles from last year, and compared this to Daniels’ and Camaras’ from this year. We see similarities between Daniels and Caruso in terms of their deflections, loose balls recoveries, screen assists and box outs, demonstrating that their respective seasons are very similar, at least so far. However, Caruso was stronger compared to the rest of the league in terms of charges drawn. Compared to Camara, Caruso tallied more deflections and loose ball recoveries but less box-outs and screen assists. This gives us more insight to the decision making of the NBA when choosing a Hustle Award recipient. Based on these comparisons, we now view Dyson Daniels as the likely Hustle Award winner for this season, based on pre-all-star break stats. The table of hustle leaders last season includes a handful of guys featured in this year’s table such as Caruso, Green and Sengun. Thus, our player breakdown is complete, and we now urge the reader to follow these players, as they are contributing to their team in unique ways that are not usually covered by the media. Now we will explore team hustle and its impact on the game.


Figure 5 Analysis:
These visualizations turn our attention to the team aspect of hustle, where the first graph displays the leaders of hustle by team in the NBA. We see that the Oklahoma City Thunder, Golden State Warriors, and Atlanta Hawks lead the way. Comparing this to the second graph, we see there is a weak to moderate correlation between a team’s hustle rating and their amount of wins, pre-all star break. However, one can hypothesize that teams with high hustle ratings rely more heavily on their hustle to win games. Conversely, other teams like the Cleveland Cavaliers and the Boston Celtics may rely on other aspects to win, like shooting efficiency or good offensive schemes. The Thunder are one of the best teams in the league and are by far the most hustling team in the league. Therefore, one could claim that their players’ hustle is contributing to their wins. Teams like the Warriors may similarly rely on their hustle, yet their lower hustle rating could be contributing to less wins than the Thunder. This is simply conjecture, and further analysis is required. In reality, there are countless factors that contribute to wins, but looking at hustle in the NBA demonstrates one of these factors and gives insight to its possible importance. We also looked at the correlations with wins and the specific hustle stats (deflections, loose balls recovered, etc.). Most of these associations were weak, but box outs and charges drawn showed the most correlation. Thus, we can see that this year there is a slight correlation between winning and hustle, but the graph gives us a better understanding of teams that use their hustle more to win games, mainly the Thunder and Warriors.


Figure 6 Analysis:
The linear regression depicts last year's regular season results, demonstrating no real association between a team’s hustle rating and the success they have during the regular season. This graph and Figure 4 convey that hustle is less influential on the game than we thought, not having a strong correlation with winning. The second graph supports this same lack of correlation, but in the playoffs. The 2024 champions and runners-up, the Celtics and Mavericks, both had comparatively low hustle rating despite achieving playoff success. Even further, high hustle teams like the Thunder, Knicks, and 76ers were eliminated early in the playoffs (first or second round). However, there is some correlation between teams and their hustle rating, hinting at the fact that certain teams or coaches preach hustle, such as the Thunder who appear high in hustle rating both this year and last year. Similarly, the Warriors and Hawks have high hustle ratings so far this season and last season. Conversely, the NBA champion Boston Celtics have consistently lower hustle ratings. Thus, we are beginning to see that hustle is fairly constant across years with certain teams. This is not surprising, but we are now able to support the claim that some teams’ style of play includes hustling, across seasons.


Figure 7 Analysis:
Here, we wanted to explore the relationship between hustle and defense, which we measured through our hustle rating and NBA’s defensive rating. A smaller defensive rating the better, as it measures the points per 100 possessions scored against them. We see a relatively strong, linear correlation between hustle this year and a team’s defensive rating. While we cannot conclude causation without a controlled experiment, we can say that there is an association. It is safe to assume that hustle contributes to defense, as deflections can contribute to steals, loose ball recoveries can limit possessions, and box outs can limit second chance opportunities. These are examples of the correlation between hustle and defense and support the idea of this interconnectedness demonstrated in the scatterplot. This is best exemplified by the Thunder, who appear again in our analysis. Looking at this graph we see they are extremely dominant defensively, as they are the most extreme outlier in the plot. They are the prime example of hustle translating to stout defense. When looking at a player's defensive rating, the same holds. While there is a weaker correlation, there still seems to be a relationship between the two variables. We examined per minute rating for this graph since defensive rating is also dependent on how much a player plays. We see there is a correlation between hustle and defense, which is expected.

Figure 8 Analysis:
We now turn our attention to the impact hustling has on players. The graph above looks at role players from last season, who averaged between 15 and 26 minutes a game. To account for the minutes difference, we used the per 36-minute hustle rating of players. We then calculated each player's minutes increase (or decrease) from last year to this season so far. We were unable to find a correlation between hustling and an improvement in minutes the following year. This can help us determine if coaches look at hustle in their decisions to give players more minutes, especially role players. It leads us to conclude that other factors are more important in determining a player’s minutes. This, however, does not mean that hustle is not a factor, but it does show that it is not a leading influence on a minute's change for role players.
Conclusions:
We set out to explore the effect of hustling in the NBA, and our results came back inconclusive. With that being said, there are still valuable conclusions to be taken away. First, watch out for players like Dyson Daniels and Toumani Camara next time you watch the NBA. We will likely see one of these players take home the NBA Hustle Award. For teams, we found that there is a slight correlation this season between hustle and winning. Although this correlation was nonexistent last season, we did get an indication of teams where hustle is a hallmark of their style of play, specifically the current number one seed in the West, the Oklahoma City Thunder. They have exhibited a strong correlation between hustle and defense, which actually pervades throughout the NBA. Regarding individual players, hustle did not seem to be a contributing factor to minutes improvement. Overall, there are countless factors at play on a game-by-game basis in the NBA, so it is hard to limit those factors to just hustle. While it is interesting to look at the hustle landscape, it still remains as a niche attribute not possessed by many. But now, next time you’re watching, make sure to look for those hustle plays and see for yourself if it helps your team secure a win.
Comentários