Is Trading Down in the First Round of the NFL Draft Beneficial?
- Bruin Sports Analytics
- Dec 15, 2022
- 10 min read
By: Amaeya Deshpande
Introduction
There is no doubt that team-building is one of the primary factors in launching a team to the Super Bowl. That final destination in February cannot be reached without successful windows from March to April in the years prior. The free agency period and the NFL Draft are critical. They highlight the risk taken by an organization by enlisting their trust into a player, hoping that the player can match or exceed their expectations. Sometimes these risks hit, but sometimes they miserably fail. This element of risk is maybe highest in trades in the NFL Draft. In draft trades, teams who trade up often give up valuable picks in later rounds of the draft and sometimes high picks in future years’ drafts to move to their ideal selection. All of this additional draft capital for the team trading down is valuable, but only data can tell whether or not it is worth trading for.

Draft day trades occur for a number of reasons. Teams trade up if they have their eyes on a prospect they believe they absolutely need or if they are concerned by the value of their pick. Meanwhile, teams trade down to acquire additional assets or move to ranges of the draft they believe consist of high value talent. Regardless of the goal, general managers are taking huge risks by moving throughout the draft order. For teams trading up, they are showing extreme commitment for the single player that they are trading up for. For teams trading down, they are depending on the rest of the draft board to fall as they expect, as well as depending on themselves to make the right selections. Considering all of these risks, and sometimes some luck, do these decisions actually pay off?
Data Selection
In order to conclude whether trade ups or trade downs are more effective, an investigation into recent draft day trades is necessary. It is significant to note that draft strategies change over time, especially with the value of certain positions changing as well as changing perceptions of each pick’s value. Considering the shifting nature of football, only recent draft trades will be evaluated. Additionally, only trades made on the day of the draft will be analyzed because those made sooner often depend on a series of factors which transpire between the trade and Draft Day that are difficult to account for. To determine a result based on the riskiest of situations, trades in which the team trading down moves at least five picks in the first round will be investigated. Trades in which teams move less than a handful of picks typically result in each team selecting exactly who they want, which means the likelihood of success hardly depends on the trade itself. Trades outside the first round include less risk because the stakes become lower as the draft progresses. Lastly, trades in which a pick was traded for a player already in the league will be dismissed because comparing rookies to veterans would be unfair.

Filtering this data results in 24 draft day trades matching this criteria from 2011 to 2019. While this sample size may be of concern, inclusion of other draft trades would dilute the data with outdated, less risky, and less meaningful trades. Here, greens represent positive results for the team trading down and reds represent negative results for the team trading down.
* = team trading down made another trade

Value Comparison
While the chart displays varying outcomes for each of these trades, comparison of other statistics can be used to determine whether or not trade downs are better than trade ups. The single statistic which can help best summarize the data is called Career Approximate Value (AV), which is the sum of integers representing a player’s predicted value for each season they were in the league, calculated for every player by profootballreference.com. Career AV is very significant in this investigation because it can be used to compare players across different eras and positions. Since there were multiple players selected by the team trading down, the sum of their Career AVs were taken in order to represent the total value acquired by the team. The histogram below shows the distribution of Career AVs for both the team trading down and trading up, trade downs represented by green and trade ups represented by red. The brown region contains the overlap of the two distributions.

There is clearly a sharp contrast between teams trading down and teams trading up. The trade down distribution appears to be relatively normal with a center around 50, whereas the trade up distribution is heavily skewed to the right, with nearly half of the observed values landing in the 0 to 20 range. The difference in that bin alone demonstrates how the risk of trading up can completely backfire. While trade downs are also very risky, the histogram shows that they can be slightly more predictable. To compare the outcomes of each trade between the team trading down and the team trading up, the graph below plots the Career AV for the trade down team on the x-axis and for the trade down team on the y-axis.

Although this data lacks any identifiable linear trend, with a correlation of only 0.264, other trends can be noticed. For example, there are far more values along the x-axis opposed to the y-axis, demonstrating how common failed trade downs are. While the regression line does not pertain too much significance, it can be noted that it only has a slope of 0.325. To better understand this value, if trade ups and trade downs benefited neither side, the slope of the regression line would be 1. Such a slight slope reveals that typically as Career AV for the trade down team increases, the expected Career AV for the trade up team increases by less than half of that amount. Furthermore, a paired t-test for this data results in a p-value less than 0.01, meaning that there can be 99% confidence that the mean Career AV values for trade downs and trade ups are not the same. In fact, the mean difference in Career AV assessed by each trade individually is an astounding 20.125, which is equivalent to about two to three years of good production. These statistics are also heavily influenced by a major outlier in the dataset, that being the trade up for Julio Jones. While these trades are possible, they are highly infrequent, occurring just once over the last decade. Meanwhile, there are multiple trades in which the team trading down received outstanding value.
Elite Players Comparison
While assessing outcome values of each trade, it was clear that teams who trade down tend to obtain more value than a team who trades up. However, Career AV is only an approximation and not a definite statistic. It cannot solely determine which drafting method is more effective. Proponents of trade ups would argue that the intention of trading up in the first round is to acquire a player who has superstar potential. While Career AV takes accolades into account, once again, it is not definite. Since trading up should put a team in a more desirable area of the draft order to select an elite player, players selected in a trade up should theoretically have a higher likelihood of winning Pro Bowl and All-Pro selections. However, the data says otherwise.


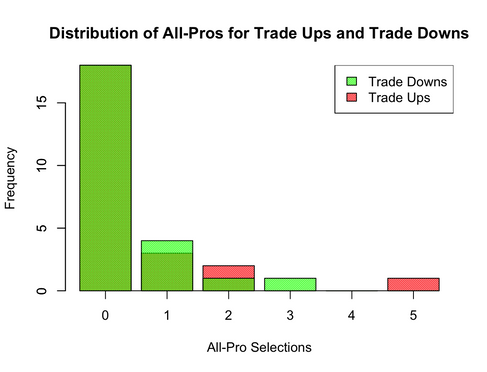
The bar plots display two distributions each, once again with green representing the team trading down and red representing the team trading up. Pro Bowl selections are determined by players, fans, and the media and All-Pro selections are solely determined by the media. Including each bar plot shows that award results are not influenced by a single group. It can easily be observed that the distributions for each bar plot are nearly identical, meaning trade ups are no more effective in landing elite talent. In reality, most picks used in trade ups and trade downs do not result in outstanding caliber players, but when they do, they are at a similar rate. Again, the Julio Jones trade up is an outlier. His seven Pro Bowls and five All-Pro selections are at least three more than the next highest players’ selections obtained in a trade up. Considering the similarities of the distributions, teams trading up have an equal likelihood of drafting an elite player despite picking more than five picks earlier than the team trading down.
Team Success Comparison
Player success is obviously important, but there is nothing an organization cares about more than team success. First round draft picks are intended to be franchise players, whose impact should elevate the caliber of the entire team. This is especially important with trades because teams who trade up often do so to acquire a high level player to help them win immediately. Additionally, trade downs can sometimes occur for a rebuilding team to simply obtain more assets. Thus, it is critical to assess both short term and long term team success when evaluating draft trades.

The plots which are provided below display the difference of a team’s record over the span of one year, two years, and three years after they made the draft trade. For example, if a team had a record of 8-8 the year prior to when a player was drafted and finished 9-7, 6-10, and 8-8 in the next three seasons, their record +/- values would be each difference from the record before the draft: +1, -2, and 0. To show each trade as its own entity, the record +/- for the trade down team is on the x-axis and on the y-axis for the trade up team. In order to best interpret these plots, they are split into quadrants respectively representing the following results: both teams improved, the trade up team improved and the trade down team declined, both teams declined, and the trade down team improved and the trade up team declined. Each of these scatterplots is accompanied by a side-by-side boxplot which does not assess each individual trade, but instead shows the distribution of record +/- for trade ups and trade downs.


Although most would infer that a trade up would result in more immediate success, the graph shows that the most common outcome after the first year is the trade down team improving their record and the trade up team lowering theirs. A major unpleasant sight for proponents of trade ups is the lack of data points in the upper two quadrants, which each represent the trade up team improving their record. Only seven of the total 24 teams which traded up kept or improved their record after the first year whereas double that amount did so for teams that traded down.


Team success appears much stronger two years after the draft trade occurred and not as strongly in favor of the team trading down. However, it can be noticed that the two least populated quadrants are the two on the left, which both represent the trade down team lowering their record. A meaningful similarity between the plots for after one year and after two years is the contrast between the second and fourth quadrants. In each plot, the second quadrant has a significantly lower count than the fourth quadrant, demonstrating that it seems more likely for a trade down team to succeed if only one of the teams is to do so.


Lastly, the identifier of long term success resembles a similar trend that the second quadrant is very unpopulated. However, neglecting the two values in that quadrant helps identify an interesting pattern. While these plots are not meant to display a pattern, this one actually appears to be somewhat linear. If there were to be a linear regression line for this data, its x-intercept would be positive and its y-intercept would be negative. If this trend is of significance, it predicts greater likelihood of record improvement for trade down teams than trade up teams. Two-thirds of all trade down teams had better records after three years, a number which strongly goes in favor of the strategy of trading down in the draft.
There is a similarity in each of the three boxplots shown above in that the median record +/- for a team who traded down is equivalent to the third quartile for teams who traded up. Statistically, this means that after one, two, and three seasons, 75% of the trade up record +/- is below the median record +/- for teams who trade down. The discrepancies between each of the boxplots support the conclusion provided by the three scatter plots that team success occurs at a higher rate in trade downs as opposed to trade ups.
Conclusion
This investigation examined multiple factors which go into determining the winner and the loser of a trade. While there are trades from which each team succeeds or each team fails, this evaluation determined that teams which trade down are benefiting far more than teams which trade up.
When comparing the value acquired on each side of the trade, a strong advantage was given to the team who traded down. Not only was the mean difference in Career AV substantial, but trade downs were far less likely to result in very little return value. In a comparison of elite players acquired via draft trades, there was no meaningful difference in the number of high level players selected by either side. Considering that first round trade ups often aim towards selecting a top tier player, it is a bad sign for trade ups that teams selecting later in the draft are hitting the jackpot equally often. Despite these outcomes strongly leaning in favor of trade downs, no conclusion could be made until team success was examined. Based on record changes over the course of three seasons, it was evident that teams who traded down were more likely to improve than teams who traded up after each of the three years. In totality, the combination of these results allows for the conclusion that trade downs are beneficial.

While the data used in this investigation helps reach this conclusion, a few points should be kept in mind. First, this sample size is somewhat small which is due to the fact that first round draft trades are not highly common. While this dataset eliminates outdated and less significant trades, it is not large enough to draw a certain conclusion. Additionally, draft value perceptions and strategies will continue to change moving forward, meaning this conclusion cannot certainly predict the successes and failures of future trade ups and trade downs. Lastly, a major component in draft trades which went undiscussed is the players selected between the trade up pick and the trade down pick. The chart shown earlier has a column including some of these key players, a few of which are already future Hall of Famers. Although the team who traded down missed out on these players, there is no telling who they would have selected at their original position, and they could have missed out on those players anyways. Also, a team who has traded down should have the assets to trade back up to prevent missing out on an elite caliber player. A great example of this occurred in 2018 when the Green Bay Packers first traded down and then traded back up for Jaire Alexander. Overall, recent NFL Draft trades result strongly in favor of the team who traded down, which could serve as encouragement for trading down in the draft moving forward.