


What Factors Best Explain a Pitcher’s WAR in the 2024 Season?
- Bruin Sports Analytics

- Apr 2
- 7 min read
By: Selina Cheng
Introduction
In baseball analytics, few statistics have revolutionized player evaluation more than Wins Above Replacement (WAR). This comprehensive metric attempts to capture a player's total contribution to their team by estimating how many more wins they provide compared to a replacement-level player. For pitchers, WAR incorporates various statistics that evaluate a player’s performance:
Earned Run Average (ERA): ERA measures how many earned runs a pitcher allows per nine innings. An earned run is a run that scores without the help of defensive errors.
A low ERA is good—it means the pitcher is effective at preventing the other team from scoring. If a pitcher has a 3.00 ERA, it means they allow about 3 runs every 9 innings, which is considered very good.
Strikeouts (K): Strikeouts count how many batters a pitcher eliminates by throwing three strikes—a measure of a pitcher's ability to overpower batters.
Walks and Hits per Inning Pitched (WHIP): WHIP calculates how many baserunners a pitcher allows per inning. A low WHIP is good—it means the pitcher is keeping opposing players from getting on base.
In this article, I explore the key factors that best explain a pitcher's WAR in the 2024 season based on an analysis of historical pitcher data from 2002 to 2024. By understanding these factors, teams can make more informed decisions about player acquisition, development, and strategy.
Exploratory Data Analysis
Exploratory Data Analysis (EDA) is a crucial step in understanding trends and patterns within a dataset, particularly in the context of Major League Baseball (MLB) pitcher performance. The attached graphs illustrate different aspects of pitcher performance using Wins Above Replacement (WAR) and other metrics like Earned Run Average (ERA).
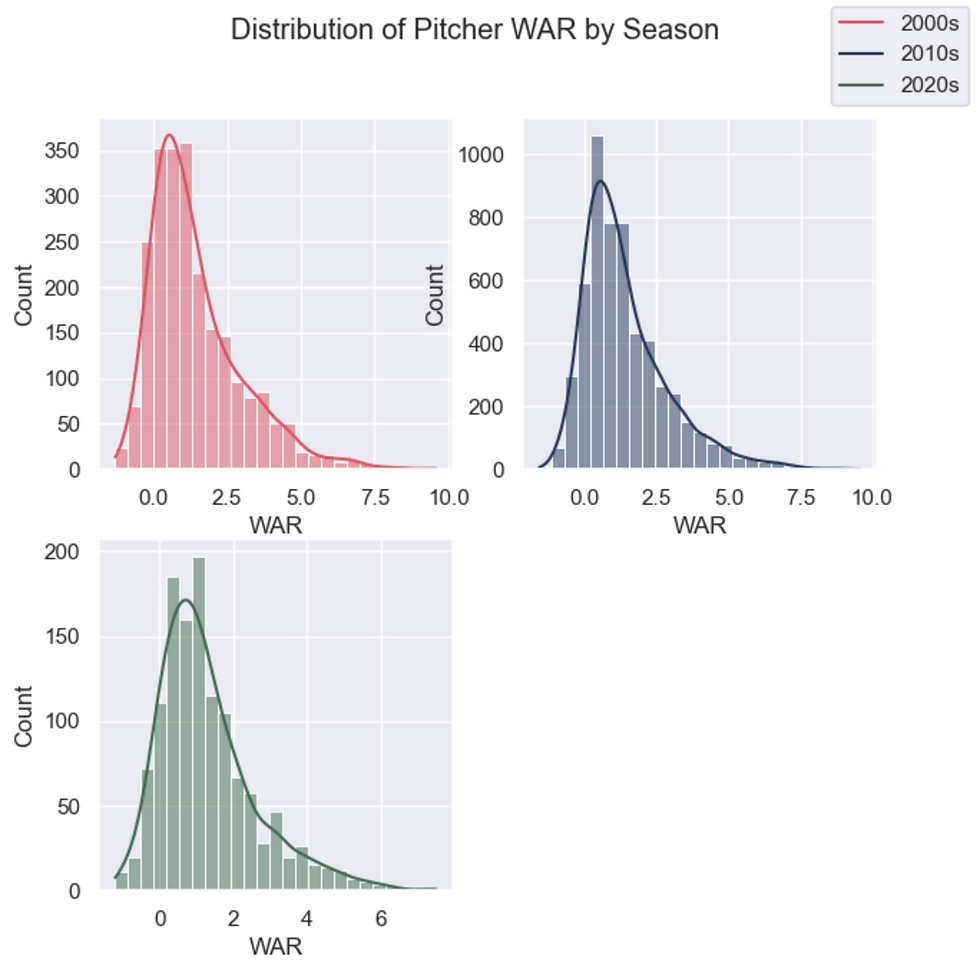
This graph presents the WAR distributions across three decades (2000s, 2010s, and 2020s). Each subplot uses a histogram with a density plot overlay to visualize how WAR values have shifted over time. Most pitchers throughout each decade have a WAR close to 0 to 1, indicating the average pitcher’s WAR hasn’t changed significantly over time. However, the 2010s distribution appears slightly more right-skewed compared to the 2000s. The 2020s dataset, though smaller, seems to maintain a similar trend.
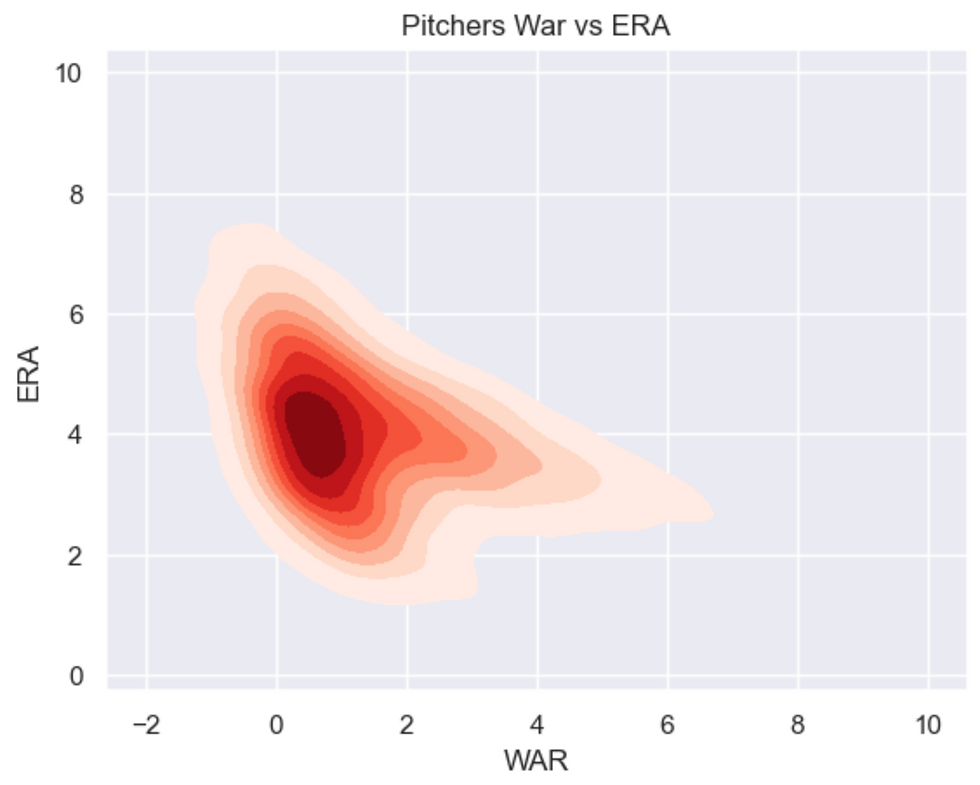
This graph is a density plot that highlights the relationship between WAR and ERA. This visualization effectively shows a strong negative correlation—pitchers with lower ERAs tend to have higher WAR values. The densest region in the plot indicates that most pitchers have an ERA between 3.5 and 5.0 with WAR values between 0 and 2. A lower ERA generally signifies better run prevention, which translates to higher WAR, reinforcing ERA as a key component of pitcher effectiveness. Additionally, the plot suggests that very high WAR values are only achieved by pitchers with ERAs below 3.0, supporting the idea that dominance in run prevention is a key factor in WAR calculations.
Methodology
Baseball teams today rely heavily on data to evaluate player performance and make strategic decisions. One important measure for pitchers is Wins Above Replacement (WAR), a statistic that estimates how much a player contributes to their team compared to a typical replacement-level player.
To better predict a pitcher's future WAR, I used a machine learning approach called ridge regression—a technique that improves prediction accuracy by preventing overfitting. This means my model avoids relying too much on any single variable, which is useful when dealing with baseball stats that are often highly interconnected.
Gathering and Cleaning the Data
Data on pitchers from 2002 to 2024 was collected with a few filters to ensure a high-quality dataset. Only qualified pitchers, or those who threw at least 50 innings per season, were included. This removes players with too little data to make meaningful predictions. Additionally, players who appeared in only one season were excluded to ensure consistency in evaluating year-over-year performance.
Selecting the Most Important Stats
Baseball has countless statistics, but not all of them are equally important for predicting WAR. To narrow it down, sequential feature selection was used, which is a method that tests different combinations of variables to find the 20 most useful ones. This helps improve model performance by removing unnecessary or redundant stats.
Preparing the Data for Machine Learning
Before training our model, all statistics need to be on the same scale. For instance, strikeouts (SO) might have values in the hundreds, while earned run average (ERA) is usually between 0 and 10. If left unchecked, the model would focus too much on larger numbers simply because of their scale.
To solve this, Min-Max Scaling was used to transform all values into a range between 0 and 1, standardizing the values so that every variable is treated equally in the model. This is a common preprocessing step in machine learning.
Training and Testing the Model
Time-series split was utilized due to the chronological nature of the data, meaning the model was trained on data from earlier seasons and tested it on later seasons. This simulates how the model would work in real-world scenarios, because teams use past data to predict future performance, not the other way around.
The model was tested using a method called backtesting, in which it was trained on all seasons before a given year and then checked its predictions for that year. This process was repeated for multiple seasons to assess consistency.
Analysis of Model Predictions
Most Significant Factors

This coefficient plot visualizes the relative importance and direction of various statistical features in the ridge regression model used to predict a pitcher's WAR (Wins Above Replacement). Each bar represents a feature's contribution to the model, with longer bars indicating a stronger influence. Positive values suggest a direct correlation with WAR, meaning that an increase in these stats is associated with higher WAR. Conversely, negative values suggest an inverse relationship, indicating that as these values increase, WAR tends to decrease. Analyzing this plot reveals which factors most significantly impact a pitcher's performance and provides insight into how teams can evaluate and develop players based on key metrics.
The following statistics were notably better at predicting future WAR than others:
Strikeouts (SO): Pitchers who strike out more batters tend to have higher WAR. This makes sense—strikeouts prevent opposing teams from making contact and scoring runs.
Age: As pitchers get older, their performance generally declines, leading to lower WAR. This aligns with the idea that physical ability tends to peak in a player's late 20s and early 30s.
Games Played (G): Surprisingly, there was a negative relationship between games played and WAR. This is likely because relief pitchers, who pitch in many games but only for short periods, accumulate less WAR than starting pitchers.
Home Run to Fly Ball Ratio (HR/FB%+): A pitcher's ability to prevent home runs is crucial. Those who allow fewer fly balls to turn into home runs tend to have higher WAR.
Previous Season WAR: A pitcher’s WAR from the previous season is a strong predictor of their WAR in the next season, meaning performance tends to carry over to some degree.
Accuracy of Regression Model
Use a line plot to compare the model’s predictions to the actual WAR of pitchers in the data set.
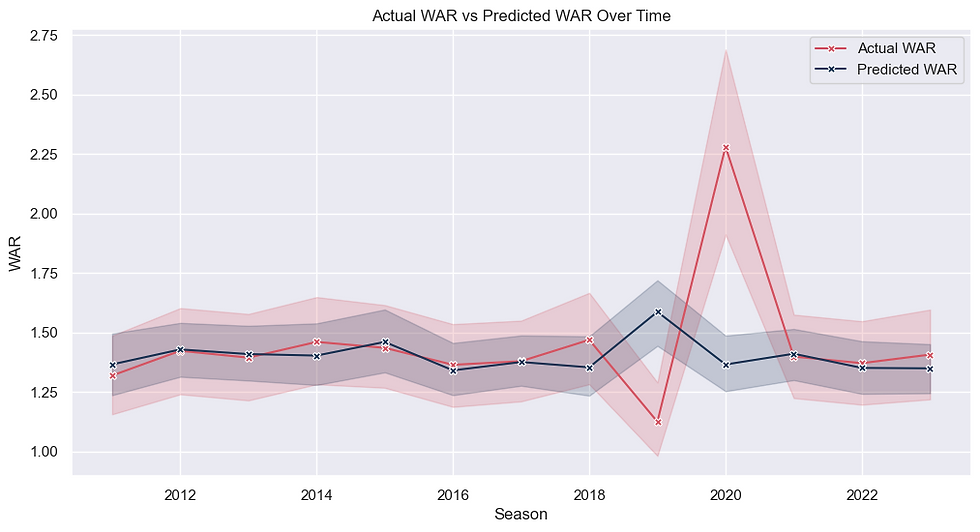
From 2011 to 2018, the model is fairly consistent with the actual average pitcher WAR. However, there is a massive spike in actual WAR for 2020, likely due to the shortened MLB season, unusual player usage, and outlier performances that distorted traditional metrics. The regression model struggled to predict this abnormal season, as reflected in the large discrepancy between actual and predicted WAR.
Additionally, two numerical metrics were used to measure the accuracy of model:
Root Mean Square Error (RMSE): This statistic reveals how far off our predictions were on average. The model’s RMSE was 1.14, which is an improvement over the overall standard deviation of WAR (1.53). This means the model’s predictions were significantly better than just guessing the average WAR.
R-squared (R2): This measures how much of the variation in WAR we could explain. The model achieved an R2 of 0.37, meaning 37% of the factors influencing WAR were captured in its prediction. This is generally to be expected due to the high variation and randomness of baseball performance.
Challenges and Limitations
Multicollinearity
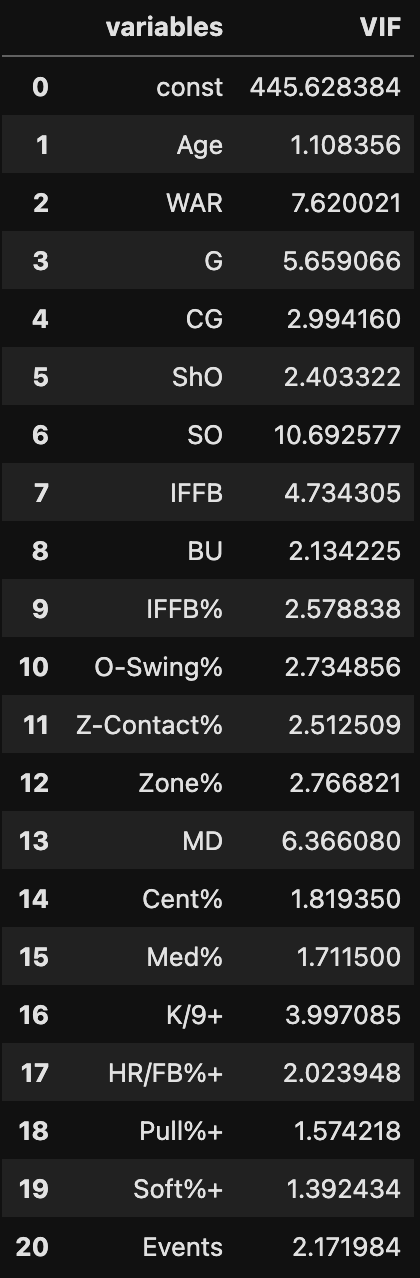
Some baseball statistics are highly correlated. For example, a pitcher’s strikeout rate and strikeouts per nine innings (K/9) are closely related because both factors influence each other. By including both, these factors can misrepresent the impact of each variable on the output. To identify which statistics are highly correlated, I calculated Variance Inflation Factors (VIF) and removed stats with VIF values above 8, such as HR/FB% and Shutdowns (SD).
Before removal, the table below represents the 20 features used to predict pitchers’ WAR.

After removal of significantly correlated features, the VIF of other variables notably decreases in the following table.
2020 COVID Season
Since the 2020 season was shortened, many pitchers didn’t reach 50 innings, leading to unusual WAR values. Including this season skewed the predicted WAR due to the lack of valid pitchers in the data.
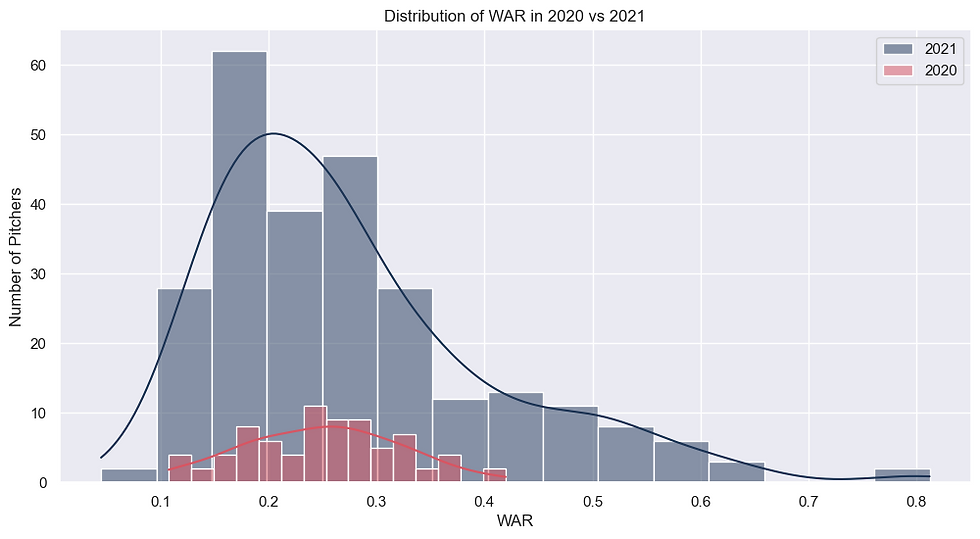
By removing the 2020 season, the model’s predictions align much more closely with actual WAR values across all years in the graph shown. By excluding 2020, the model avoids learning from an outlier season that didn’t follow normal patterns, resulting in better overall accuracy. The removal of 2020 also slightly improved the RMSE from 1.169 to 1.141.

Starters vs. Relievers
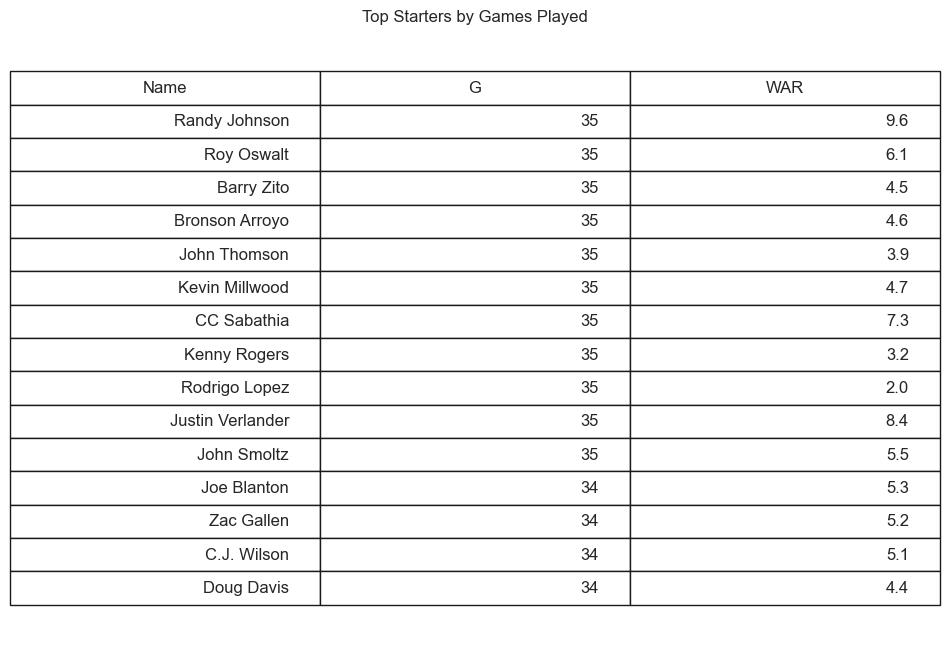

Combining starting pitchers and relief pitchers in one model isn’t ideal, because relief pitchers throw in more games but generally have lower WAR as shown in the tables above. This discrepancy heavily skews results—to improve this prediction model in the future, separate models should be made to distinguish between starters and relievers.
Practical Application
This type of analysis can be utilized in various ways to benefit MLB teams in future seasons. Teams can identify what factors will boost player development most significantly, and teams can use age-based WAR trends to decide how much to invest in older pitchers. Understanding the factors that affect WAR can also help teams in future player acquisitions and develop the best pitcher usage strategy for managers to make the most optimal decisions throughout the season.
Conclusion
While WAR is influenced by many factors, certain statistics—like strikeouts, age, and previous performance—are particularly important in predicting future success. Although the model explains only 37% of WAR variation, it provides a significant edge over guessing.
For future improvements, separate models for starters and relievers should be created, as well as more advanced metrics, like pitch velocity and spin rate, could be implemented. Other machine learning models could also be utilized for potentially better predictions based on the data. Ultimately, while baseball will always have an element of unpredictability, data-driven insights like these can give teams a competitive advantage in making smarter decisions.


Comments